
OPERATION OF STRATTON AND ALGONQUIN DAMS
i
OPERATION OF STRATTON AND ALGONQUIN DAMS
ii
ABSTRACT
The Office of Water Resources has operated the gate control structure at Stratton Dam
since 1939 and the Algonquin Dam control works since 2002. This report gives a
description of the control works and outlines the operational plan.
The Office of Water Resources first developed and publicly discussed the operational
plan for Stratton Lock and Dam in 1989. The 1989 plan was revised in 1991 to address
the issue of ice jam flooding in Kane County downstream of Algonquin and since that
time the plan has included a method of operation which would minimize the threat of ice
jams. In 2002 the new gates at Stratton Lock and Dam and Algonquin Dam were
completed, and a modified operational plan was developed and discussed publicly
which incorporated operations of the gate at Algonquin Dam. That plan continues to be
reevaluated as better information is made available.
Flooding is a natural phenomenon along the Chain of Lakes and the Fox River. While
improvements to the operating plan can be made, there is no guarantee of substantial
reductions in flood stages.
OPERATION OF STRATTON AND ALGONQUIN DAMS
iii
CONTENTS
ABSTRACT ......................................................................................................................ii
CONTENTS .................................................................................................................... iii
HISTORY AND OWNERSHIP ......................................................................................... 1
STRATTON DAM ........................................................................................................ 1
ALGONQUIN DAM ...................................................................................................... 2
DESCRIPTION OF CHAIN OF LAKES ........................................................................... 3
DESCRIPTION OF STRATTON DAM ............................................................................. 3
DESCRIPTION OF ALGONQUIN DAM ........................................................................ 14
OPERATION OBJECTIVES .......................................................................................... 20
GAGING ........................................................................................................................ 23
STRATTON AND ALGONQUIN OPERATIONS ........................................................... 30
RAINFALL SNOWMELT EVENTS AT WINTER POOL ............................................. 32
WINTER OPERATIONS/ICE JAMS ........................................................................... 34
RAINFALL EVENTS AT SUMMER POOL ................................................................. 39
FISH LADDER OPERATIONS................................................................................... 39
OPERATIONS MODELING ........................................................................................... 40
RAINFALL-RUNOFF MODEL .................................................................................... 40
UNSTEADY FLOW-ROUTING MODEL .................................................................... 41
FLOOD WARNING PLAN ............................................................................................. 45
LOW FLOW OPERATIONS .......................................................................................... 47
TRANSITION TO SUMMER POOL ............................................................................... 48
WINTER DRAWDOWN ................................................................................................. 49
LOCAL INPUT TO OPERATIONS ................................................................................ 53
PERMITS AND APPROVALS ....................................................................................... 53
RECENT IMPROVEMENTS TO OPERATIONS: .......................................................... 53
WORK YET TO BE PERFORMED: ............................................................................... 54
REFERENCES .............................................................................................................. 55
OPERATION OF STRATTON AND ALGONQUIN DAMS
iv
FIGURES
Figure 1: Storage in Chain of Lakes ................................................................................ 3
Figure 2: Plan View of Stratton Lock and Dam ................................................................ 5
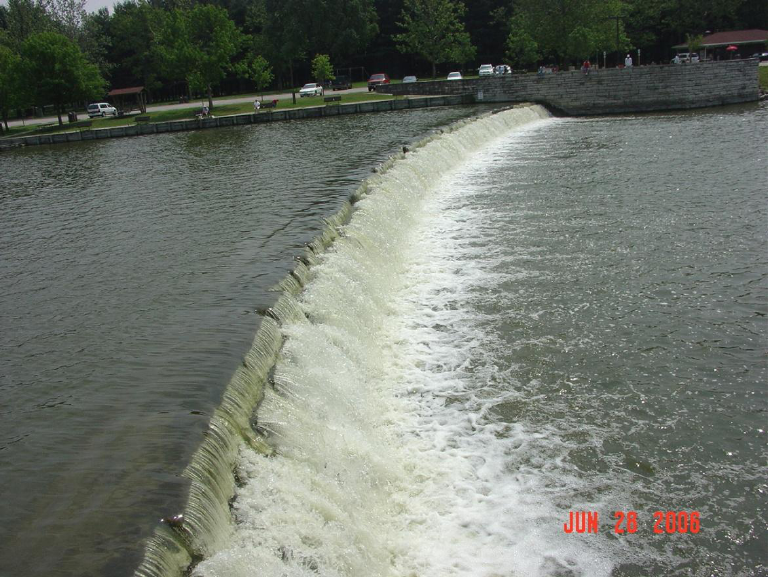
Figure 4: Stratton Dam Spillway ...................................................................................... 6
Figure 3 Plan View of Stratton Lock and Dam ................................................................. 6
Figure 5: Downstream End of Stratton Dam Fish Ladder ................................................ 7
Figure 6: Downstream Side of Stratton Dam Sluice Gates .............................................. 7
Figure 7: Stratton Dam Hinged Crest Gate ..................................................................... 8
Figure 8: Cross Section of Stratton Dam Sluice Gate ................................................... 11
Figure 9: Cross Section of Stratton Hinged Crest Gate and Broad Crested Weir ......... 12
Figure 10: Cross Section View of Generic Hinged Crest Gate ...................................... 13
Figure 11: Cross Section of Algonquin Hinged Crest Gate and Ogee Spillway ............. 17
Figure 12: Plan View of Algonquin Dam ........................................................................ 18
Figure 13: Algonquin Dam Spillway .............................................................................. 19
Figure 14: Algonquin Dam Hinged Crest Gate .............................................................. 19
Figure 15: Operational Constraints ............................................................................... 22
Figure 16: Gaging In Southern Portion of Watershed ................................................... 28
Figure 17: Gaging in Northern Portion of Watershed .................................................... 29
Figure 18: Flow Duration Curves ................................................................................... 31
Figure 19: Partial Duration Series for Algonquin Gage.................................................. 33
Figure 20: Partial Duration Series for Algonquin Gage (1916-2010) ............................. 34
Figure 21: Ice Jams and Flood Flows............................................................................ 38
Figure 22: Flow Chart for Flood Operations at Stratton Dam ........................................ 43
OPERATION OF STRATTON AND ALGONQUIN DAMS
v
TABLES
Table 1: Stratton Lock and Dam Control Works .............................................................. 4
Table 2: Summary of Hydraulic Conditions and Discharge Equations for Different Flow
Regimes at Stratton Dam Control Structures ................................................... 9
Table 3: Algonquin Dam Control Works ........................................................................ 14
Table 4: Summary of Hydraulic Conditions and Discharge Equations for Different Flow
Regimes at Algonquin Dam Control Structures .............................................. 15
Table 5: Fox River Stream Gaging Stations (Current) ................................................... 24
Table 6: Fox River Stream Gaging Stations (Historical) ................................................ 25
Table 7: Stage/Elevation Relationship for Various Gages ............................................. 26
Table 8: Annual Discharge Frequency Distributions for Select Gages .......................... 30
Table 9 Season Precipitation Frequency Distributions for 24-Hour Storm Period and
Recurrence Intervals of 2 to 100 Years ............................................................ 32
Table 10: Months in which Flood Events have Occurred at the Algonquin Gage (1916-
2009)............................................................................................................ 33
Table 11: Ice Jams and Flood Flows ............................................................................. 37
Table 12: Summer Pool Flood Events since 1939 ........................................................ 39
Table 13: Flood Warning Stages along the Fox River ................................................... 45
Table 14: Fox River Water Withdrawls .......................................................................... 47
Table 15: Dam Breach Analysis For Stratton And Algonquin Dams With Hinged Crest
Gates - Peak Stage ..................................................................................... 52
OPERATION OF STRATTON AND ALGONQUIN DAMS
1
HISTORY AND OWNERSHIP
STRATTON DAM
McHenry County was established on January 16, 1836. The government plat for
Township 44 North, Range 8 East was signed December 17, 1839, and no dam at
McHenry was indicated on this survey. Early in the 1900's a group of property owners
and others organized the Fox River Navigable Waterway Association. In 1907, this
association secured a Federal Permit and constructed a wooden dam across the Fox
River to improve navigation for recreation in the Chain-O-Lakes. This dam deteriorated,
and was replaced with a three foot steel sheet piling structure equipped with three foot
high flash boards prior to 1915. This dam was constructed with a lock at the east end,
on the opposite side of the present lock. This dam was indicated on a 1923 map
prepared by the Division of Waterways and was similar to the 1915-16 River and Lakes
Commission maps, covering the Fox River.
In 1923-24, the titles, rights and interest in the dam, lock and adjacent properties were
conveyed to the State of Illinois after passage of the McHenry County Dam Act ( 615
ILCS 100). This act provides the Department of Natural Resources with the duty of
maintaining the “dam at a suitable height to properly provide a sufficient depth of water
north of the dam in the Fox River and the lakes adjacent thereto and connected
therewith to enable said waters to be navigable.” A November 9, 1936 survey of the
dam site showed the crest length to be 210.7 feet. The dam crest was at elevation
733.6 with the top of the three foot flash boards at 735.6. On the date of the survey the
pool elevation was 736.07 and the tailwater elevation was 732.50. Major damage
occurred to the structure from the floods of November 1937 and July 1938.
In 1939, the State of Illinois Department of Public Works and Buildings, Division of
Waterways (predecessor to the Office of Water Resources), under contract FR-14
constructed the present dam and gate control structure (Department of Public Works,
1938). Also in 1939, the State of Illinois made the initial land acquisition of 15 acres for
McHenry Dam State Park, which became a part of Moraine Hills State Park, which is
located on the east side of the Fox River.
The present boat lock was constructed in 1958-60 under Department of Public Works
and Buildings contracts FR-109 and FR-113. The lock was opened for public use on
June 1, 1960. A number of other contracts have been awarded and completed since
1939 to repair and maintain the existing dam, buildings and site area. None of these
contracts has changed the hydraulic characteristics of the outlet works except for the
installation of the hinged crest gate in 2002 by the United States Army Corps of
Engineers.
OPERATION OF STRATTON AND ALGONQUIN DAMS
2
ALGONQUIN DAM
McHenry County was established January 16, 1836. The government Township 43
North, Range 8 East plat was signed on April 18, 1840. A ferry called Cornishers Ferry
was indicated in the NW 1/4 of Section 34. The Village of Algonquin was formerly
called Oceola. William Sloan was given authority to build a mill dam by an Act of
Legislation approved February 11, 1853. A dam was built about 1854. In 1915 a dam
existed along with a mill and a tail race on the east side of the river. On May 12, 1939
the State of Illinois acquired title by Quit Claim to the mill lot and dam from the Public
Service Co. of Northern Illinois. In 1946-47 the State, Division of Waterways under
contract PW-8 built the Algonquin Dam, a short distance south of the old dam and also
removed the old dam. In 2002 the United States Army Corps of Engineers installed the
hinged-the crest gate at Algonquin Dam.

OPERATION OF STRATTON AND ALGONQUIN DAMS
3
DESCRIPTION OF CHAIN OF LAKES
The Chain of Lakes has a surface area of approximately 6,900 Acres (Kothandaramon,
1977) and is primarily used for recreation with some flood control benefits. There are
approximately 1,250 square miles, or 800,000 acres, that drain to Stratton Lock and
Dam. Between an elevation of 736.8 feet (low end of summer pool target range) and
737.2 feet (high end of summer pool target range) there is 3,000 acre-feet of storage in
the Chain of Lakes; an average of 3/64 inch of runoff from the watershed upstream of
the Chain of Lakes will fill the 3,000 acre-feet.
Figure 1: Storage in Chain of Lakes
DESCRIPTION OF STRATTON DAM
Stratton Dam is located at river mile 97.7 (Healy, 1979) on the Fox River and controls
the outflow of water from the Fox Chain of Lakes in McHenry County. The drainage
area at the dam is 1,250 square miles.
The dam control structures consist of a spillway, five sluice gates, a hinged crest gate, a
navigation lock and a fish ladder. The specifics of the control works are given in Table 1
(Department of Transportation, 1976). Important note: the crest length of Stratton Dam
before the placement of hinged-crest gates was 282 feet. None of the other dimensions
and elevations of the dam have changed.
735
736
737
738
739
740
741
742
0 20,000 40,000 60,000 80,000 100,000
Storage Volume in Acre-Feet
Water Surface Elevation
2
3
4
5
6
7
8
9
Stage in Fox Lake in Feet

OPERATION OF STRATTON AND ALGONQUIN DAMS
4
Table 1: Stratton Lock and Dam Control Works
Fixed Spillway Data
Crest Length
221 ft.
Radius of Spillway Crest Curvature
419 ft.
Spillway Crest Average Elevation
736.76 ft. NGVD
Spillway Low Point Elevation
736.68 ft. NGVD
Approach Channel Bottom Elevation
729.5 ft. NGVD
Downstream Channel Bottom
Elevation
725.1 ft. NGVD
Length of Fish Ladder Crest
4 ft.
Elevation of Fish Ladder Crest
Adjustable
Height of Spillway
6.5 ft.
Roughly Trapezoidal Cross Section with Broad Crest
Vertical Lift Gates Data
Number of Vertical Lift Gates
5
Width of Gate Opening
13.75 ft
Gate Sill Elevation
731.15 ft. NGVD
Maximum Gate Opening
9.0 ft.
Elevation of Downstream End Sill
731.65 ft. NGVD
Hinged Crest Gate Data
Width of Gate Opening
50 ft.
Top of Gate Closed (Upright)
737.20 ft. NGVD
Top of Gate Open (Flat)
730.50 ft. NGVD
Concrete Floor Elevation
730.083 NGVD
Top of Pier
742.0 NGVD
NGVD refers to the National Geodetic Vertical datum of 1929
0 stage of headwater gage = elevation 733.0 NGVD
0 stage of tailwater gage = elevation 730.15 NGVD

OPERATION OF STRATTON AND ALGONQUIN DAMS
5
Figure 2: Plan View of Stratton Lock and Dam
OPERATION OF STRATTON AND ALGONQUIN DAMS
6
In 1988, the United States Geological Survey (USGS) completed a study under contract
with the Division of Water Resources (DWR) to look at discharge ratings for the control
structures at Stratton Dam (Fisk, 1988). Beginning in 2004 the USGS made additional
flow measurements for various flow conditions and gate openings to update the earlier
Fisk report and to develop a discharge rating for the hinged crest gate. Table 2 gives a
summary of the hydraulic conditions and discharge equations derived for different flow
regimes at the Stratton Dam control structures.
Figure 4: Stratton Dam Spillway
Figure 3 Plan View of Stratton Lock and Dam

OPERATION OF STRATTON AND ALGONQUIN DAMS
7
Figure 5: Downstream End of Stratton Dam Fish Ladder
Figure 6: Downstream Side of Stratton Dam Sluice Gates

OPERATION OF STRATTON AND ALGONQUIN DAMS
8
Figure 7: Stratton Dam Hinged Crest Gate

OPERATION OF STRATTON AND ALGONQUIN DAMS
9
Table 2: Summary of Hydraulic Conditions and Discharge Equations for Different
Flow Regimes at Stratton Dam Control Structures
Structure
Flow Regime
Hydraulic
Conditions
Equations
Broad-
Crested Weir
Free
60.0
1
3
BCW
BCW
h
h
5.1
1
BCW
BhCQ
BCWBCW
087.0
1
94.2 hC
BCW
ftB 225
59.1
1
5.661
BCW
hQ
BCW
Hinged-Crest
Gate
Free
75.0
1
3
HCG
HCG
h
h
5.1
1
HCG
BhCQ
HCGHCG
135.0
1
87.3
HCG
HCG
p
h
C
HCG
ftB 50
135.0365.1
1
5.193
HCGHCG
phQ
HCG
Hinged-Crest
Gate
Submerged
75.0
1
3
HCG
HCG
h
h
5.1
1
HCG
BhCCQ
SHCGHCGHCG
94.2
1
3
471.0
HCG
HCG
h
h
C
SHCG
135.094.2
3
305.4
1
14.91
HCGHCGHCG
phhQ
HCG

OPERATION OF STRATTON AND ALGONQUIN DAMS
10
Structure
Flow Regime
Hydraulic
Conditions
Equations
Sluice Gate
Weir
Free Weir
73.0
1
SL
SL
h
h
g
and
5.1
1
SL
BhCQ
SLWSL
80.0
1
3
SL
SL
h
h
101.0
1
75.3
hC
SLW
ftftgatesB 8.6875.135
40.1
1
258
SL
hQ
SL
Sluice Gate
Weir
Submerged
Weir
73.0
1
SL
SL
h
h
g
and
5.1
1
SL
BhCCQ
SSLWSLWSL
80.0
1
3
SL
SL
h
h
33.1
1
3
750.0
SL
SL
h
h
C
SSLW
33.1
3
73.2
1
193
SLSL
hhQ
SL
Sluice Gate
Orifice
Free Orifice
73.0
1
SL
SL
h
h
g
and
5.0
1
)2(
SLSL
ghBhCQ
gSLOSL
1
3
SL
SL
g
h
h
or
062.0429.0
1
271.0
SL
gSLO
hhC
70.0
1
3
SL
SL
h
h
ftftgatesB 8.6875.135
2
/2.32 sftg
938.0929.0
1
150
SLSL
gSL
hhQ
Sluice Gate
Orifice
Submerged
Orifice
73.0
1
SL
SL
h
h
g
and
5.0
1
)2(
SL
ghBhCCQ
gSSLOSLOSL
1
3
SL
SL
g
h
h
and
17.3
1
3
325.0
SL
SL
h
h
C
SSLO
70.0
1
3
SL
SL
h
h
17.3
3
938.010.4
1
6.48
SLSLSL
hhhQ
gSL

OPERATION OF STRATTON AND ALGONQUIN DAMS
11
Figure 8: Cross Section of Stratton Dam Sluice Gate

OPERATION OF STRATTON AND ALGONQUIN DAMS
12
Figure 9: Cross Section of Stratton Hinged Crest Gate and Broad Crested Weir

OPERATION OF STRATTON AND ALGONQUIN DAMS
13
Figure 10: Cross Section View of Generic Hinged Crest Gate
This section view of a generic hinged crest gate shows how the inflation/deflation of the
air bladder that is underneath the steel gate skin causes the steel gate skin to raise or
lower

OPERATION OF STRATTON AND ALGONQUIN DAMS
14
DESCRIPTION OF ALGONQUIN DAM
Algonquin Dam is located at river mile 81.6 on the Fox River. The drainage area at the
dam is 1,403 square miles. An 849 acre reservoir is created by the dam which is
primarily used for recreation. Table 3 shows the spillway data for Algonquin Dam
(Department of Transportation, 1976). Important note: the crest length of Algonquin
Dam before the placement of hinged-crest gates was 300 feet. None of the other
dimensions and elevations of the dam have changed.
Table 3: Algonquin Dam Control Works
Fixed Spillway Data
Crest length
242 ft
Spillway Crest Average Elevation
730.10 ft. NGVD
Spillway Low Point Elevation
730.10 ft. NGVD
Approach Bottom Elevation
722.2 ft. NGVD
Downstream Bottom Elevation
723.4 ft. NGVD
Height of Spillway
9.0 ft
0gee Shaped Spillway
Hinged Crest Gate Data
Width of Gate Opening
50 ft
Top of Gate Closed (Upright)
730.60 ft. NGVD
Top of Gate Open (flat)
724.00 ft. NGVD
Concrete Floor Elevation
723.583 ft. NGVD
Top of Pier
735.00 ft. NGVD
0 stage on Algonquin headwater gage = elevation 729.48 NGVD
0 stage on Algonquin tailwater gage = elevation 719.48 NGVD
0 stage on Algonquin downstream tailwater gage = elevation 719.48 NGVD

OPERATION OF STRATTON AND ALGONQUIN DAMS
15
Table 4: Summary of Hydraulic Conditions and Discharge Equations for Different Flow
Regimes at Algonquin Dam Control Structures
Structure
Flow
Regime
Hydraulic
Conditions
Equation of Flow
Ogee
Spillway
(Hinged-
Crest Gate
Closed
1
)
Free
60.0
1
3
OS
OS
h
h
5.1
1
OS
BhCQ
OSOS
Ogee
Spillway
(Hinged-
Crest Gate
Open
2
)
Free
0.5
1
3
OS
OS
h
h
or
363.0
1
67.2
OS
hC
OS
ftB 242
863.1
1
1.646
OS
hQ
OS
Ogee and
Spillway
Free
60.0
1
3
OS
OS
h
h
5.1
1
OS
BhCQ
SS
and
Hinged
Crest
546.0
1
34.2
OS
hC
OS
(Hinged
Crest Gate
ftB 292
At
Spillway
Elevation)
046.2
1
3.683
OS
hQ
OS
Ogee
Spillway
(Hinged-
Crest Gate
Open)
Affected
10.5
1
3
OS
OS
h
h
5.1
1
OS
BhCCQ
AOSOSOS
905.0
1
31
930.0
1
31
149.0
442.0
HCG
HCGHCG
OS
OSOS
HCG
h
hh
h
hh
pC
AOS
905.0
1
31
930.0
31
149.0930.0
1
)(5.285
HCG
HCGHCG
OSOSHCGOS
h
hh
hhphQ
OS

OPERATION OF STRATTON AND ALGONQUIN DAMS
16
Structure
Flow
Regime
Hydraulic
Conditions
Equation of Flow
Hinged-
Crest Gate
Free
77.0
1
3
HCG
HCG
h
h
5.1
1
HCG
BhCQ
HCGHCG
152.0
1
33.3
HCG
HCG
p
h
C
HCG
ftB 50
152.0348.1
1
5.166
HCGHCG
phQ
HCG
Hinged-
Crest Gate
Submerged
76.0
1
3
HCG
HCG
h
h
5.1
1
HCG
BhCCQ
SHCGHCGHCG
472.0
1
3
882.0
HCG
HCG
h
h
C
SHCG
152.0472.0
3
820.1
1
9.146
HCGHCGHCG
phhQ
HCG

OPERATION OF STRATTON AND ALGONQUIN DAMS
17
Figure 11: Cross Section of Algonquin Hinged Crest Gate and Ogee Spillway
p
HCG

OPERATION OF STRATTON AND ALGONQUIN DAMS
18
Figure 12: Plan View of Algonquin Dam

OPERATION OF STRATTON AND ALGONQUIN DAMS
19
Figure 13: Algonquin Dam Spillway
Figure 14: Algonquin Dam Hinged Crest Gate
OPERATION OF STRATTON AND ALGONQUIN DAMS
20
OPERATION OBJECTIVES
Daily operations at Stratton Lock and Dam and Algonquin Dam are managed by
collecting data, evaluating conditions, and determining operational adjustments to affect
the resulting system performance.
Some of these data collected include the following:
Forecasted peak flows from National Weather Service
Lake Stages as measured at Channel Lake, Nippersink Lake, and Fox Lake
River flows as computed for the Fox River at New Munster, Wisconsin and
Nippersink Creek at Spring Grove
River stages at Johnsburg, Algonquin and Elgin
These two dams affect the flows and stages in four distinct reaches of the Fox River:
Reach 1 - State line to outlet of Pistakee Lake
Reach 2 - Pistakee Lake outlet to Stratton Lock and Dam
Reach 3 - Stratton Lock and Dam to Algonquin Dam
Reach 4 - Fox River downstream from Algonquin
Primary flow control is achieved at Stratton Lock and Dam. The operation of this
structure can affect the outflow from the lakes and river above Stratton Lock and Dam
and the inflow to Reach 3. Gate adjustments at Algonquin affect the stages through
Reach 3 but have little effect on flows passing downstream. There are no operational
controls in Reach 1 or Reach 4.
Operational Objectives:
1. During summer normal flow conditions, the dams are operated to maintain the
recreational pools in Reach 1, Reach 2 and Reach 3. The objective stage
upstream of Algonquin dam is 1.8 feet. Normal summer pool in the Chain of
Lakes is in the range of 3.8 to 4.2 feet.
2. When summer flood flows occur, the sluice gates at Stratton Lock and Dam are
utilized to pass flood waters downstream with the following constraints and/or
conditions:
Flood stages in Reach 1,Reach 2, Reach 3 or Reach 4
Observed rainfall and projected total inflows to the Chain of Lakes
Forecast rainfall over the Fox River watershed
Hinged Crest gate not operated until flows or stages are expected that
would indicate substantial flooding upstream and downstream
Volume of available storage in the Chain of Lakes
There is not enough storage in the Chain of Lakes, nor capacity in the
downstream river, to eliminate flooding. Flooding occurs due to large or
extended periods of rainfall, or due to snow melt, or combinations of such events.
OPERATION OF STRATTON AND ALGONQUIN DAMS
21
3. During winter ice jam events the sluice gates at Stratton Lock and Dam are
utilized to restrict flows downstream to 1100 cfs if possible with the following
constraints and/or conditions:
An accumulation of 60 degree-freezing days
Very cold temperatures (daily high temperature < 20 degrees)
Operating the system based on anticipated conditions has been occurring for the past
several years. This office regularly monitors inflow points at New Munster, Wisconsin
and Nippersink Creek in Illinois to verify inflows to the system, and monitors rainfall
records to estimate additional runoff which the system will receive in the near future.
Forecasted and predicted conditions are then reviewed and the best operational
procedure is determined from the operating plan. Those operational decisions consider
all impacts, upstream as well as downstream of Stratton Lock and Dam. Frequently,
flows are restricted to allow downstream tributaries to peak before releases are
increased, or in winter time periods, to minimize ice related conditions. At other times,
flows are increased early to minimize the peak flows which might otherwise be passed
downstream and to minimize rises in the lakes. Figure 16 identifies some of the
operational constraints that must be considered during the operation of Stratton and
Algonquin Dams.

OPERATION OF STRATTON AND ALGONQUIN DAMS
22
Figure 15: Operational Constraints

OPERATION OF STRATTON AND ALGONQUIN DAMS
23
GAGING
Stream gaging plays a major role in the operation of Stratton Dam. Table 5 lists the
telemetry stations used in the daily operations, and Figures 17 and 18 shows the
location of these gages. The telemetry equipment is an electrical apparatus that
measures water stage and transmits it by telephone or satellite to a receiving station. At
the receiving station the water stage is then recorded. Twice daily and more frequently
during major storm events each of these stations are contacted and readings are taken.
In addition, wind speed and direction, precipitation, current temperature, and maximum
and minimum daily temperature are recorded at Stratton Dam.
Numerous web sites identify present conditions as well as forecast conditions. Some of
those web sites are listed here for public access:
Daily Fox River Stages
http://waterdata.usgs.gov/nwis/current?multiple_site_no=05545750%0D%0A05547000
%0D%0A05547500%0D%0A05548000%0D%0A05548280%0D%0A05548500%0D%0
A05549500%0D%0A05549501%0D%0A05550000%0D%0A05550001%0D%0A055510
00%0D%0A05551001&search_site_no_match_type=exact&index_pmcode_STATION_
NM=1&index_pmcode_DATETIME=2&index_pmcode_00065=3&index_pmcode_00060
=4&index_pmcode_MEAN=&index_pmcode_MEDIAN=&index_pmcode_00055=&index
_pmcode_72019=&index_pmcode_00045=&sort_key=site_no&group_key=NONE&sitefi
le_output_format=html_table&column_name=agency_cd&column_name=site_no&colu
mn_name=station_nm&format=html_table&html_table_sort_key=site_no&html_table_gr
oup_key=NONE&rdb_compression=file&list_of_search_criteria=multiple_site_no%2Cre
altime_parameter_selection
Real Time Precipitation Data
http://il.water.usgs.gov/nwis-w/IL/datasum.components/precip.cgi
Quantitative Precipitation Forecasts
http://www.hpc.ncep.noaa.gov/qpf/qpf2.shtml
National Weather Service – Chicago, Illinois
http://www.crh.noaa.gov/lot/
USGS Real Time Water Data for Illinois
http://waterdata.usgs.gov/il/nwis/rt
OPERATION OF STRATTON AND ALGONQUIN DAMS
24
Table 5: Fox River Stream Gaging Stations (Current)
Station Name
Gage #
Years of Record
Area (mi
2
)
Gages Used for Daily Operations
Fox River at New Munster, WI (Wilmot)
05545750
1939-present
811.0
Channel Lake near Antioch
05547000
1939-present
Fox Lake near Lake Villa
05547500
1939-present
Nippersink Lake at Fox Lake
05548000
1939-present
Nippersink Creek near Spring Grove
05548280
1966-present
192.0
Fox River at Johnsburg
05548500
1939-present
1205.0
Fox River at McHenry
05549500
1941-present
1250.0
Fox River at Stratton Dam (TW)
05549501
1987-present
1250.0
Fox River at Algonquin (HW)
05550000
1915-present
1403.0
Fox River at Algonquin (TW)
05550001
2002-present
1403.0
Downstream Tailwater at Foot bridge
2009-present
Additional USGS Continuous Recording Gages (Current and Historical)
Fox River at Waukesha, WI
05543830
1963-present
126.0
Mukwonago River at Mukwonago, WI
05544200
1973-present
74.1
Poplar Creek at Elgin
05550500
1951-present
35.2
Fox River at South Elgin
05555100
1989-present
1556.0
Ferson Creek near St. Charles
05551200
1960-present
5.7
Fox River near Montgomery
05551540
2002-present
1732.0
Blackberry Creek near Yorkville
05551700
1960-present
70.2
Fox River at Dayton
05552500
1914-present
2642.0
Additional OWR Gages (Current and Historical)
Fox River at Geneva
SGO3707
1962-present
1652.0
Fox River at Yorkville
SGO3705
1962-present
1804.0
OPERATION OF STRATTON AND ALGONQUIN DAMS
-25-
Table 6: Fox River Stream Gaging Stations (Historical)
Station Name
Gage #
Years of
Record
Area (mi
2
)
USGS Continuous Recording Gages (Historical)
White River near Burlington, WI
05535300
1973-1982
97.5
Squaw Creek at Round Lake
05547755
1989-2005
17.2
Nippersink Creek above Wonder
Lake
05548105
1994-1997
84.5
Nippersink Creek below Wonder Lake
05548110
1994-1997
97.3
Boone Creek near McHenry
05549000
1948-1982
15.5
OWR Gages (Historical)
Grass Lake
Staff Gage
1965-1994
Cary Rawson Bridge
Staff Gage
1987-1994
Fox River Grove Bridge U.S.
Staff Gage
1965-1994
Fox River at Route 173 Bridge
SGO3708
1961-1993
871.0
Fox River at Stratton Dam
SGO3738
1962-1989
1250.0
Fox River at South Elgin Dam
SGO3704
1962-1989
1556.0
Fox River near Aurora
SGO3740
1947-1979
1706.0
Fox River at Montgomery
SGO3706
1969-2002
1732.0
Nippersink Creek near Solon Mills
SGO3735
1962-1966
185.0
Nippersink Creek at Spring Grove
SGO3736
1952-1960
199.0
Blackberry Creek near Elburn
SGO3741
1965-1969
6.0
Blackberry Creek near Sugar Grove
SGO3742
1965-1979
29.6

OPERATION OF STRATTON AND ALGONQUIN DAMS
-26-
Table 7: Stage/Elevation Relationship for Various Gages
Fox
River at
New
Munster
Channel
Lake
near
Antioch
Fox
Lake
near
Lake
Villa
Nippers
ink
Lake at
Fox
Lake
Nippersi
nk
Creek
near
Spring
Grove
Fox
River at
Johnsbu
rg
Fox
River at
Stratton
Dam
(HW)
Fox
River at
Stratton
Dam
(TW)
Fox
River at
Algonqui
n Dam
(HW)
Fox
River at
Algonqu
in Dam
(TW)
Fox
River at
South
Elgin
Gage
Datum
735.72
733.00
733.00
733.00
746.00
733.00
733.00
730.15
729.48
719.48
687.95
Gage
Stage
Gage Elevation
0.0
735.72
733.00
733.00
733.00
746.00
733.00
733.00
730.15
729.48
719.48
687.95
0.2
735.92
733.20
733.20
733.20
746.20
733.20
733.20
730.35
729.68
719.68
688.15
0.4
736.12
733.40
733.40
733.40
746.40
733.40
733.40
730.55
729.88
719.88
688.35
0.6
736.32
733.60
733.60
733.60
746.60
733.60
733.60
730.75
730.08
720.08
688.55
0.8
736.52
733.80
733.80
733.80
746.80
733.80
733.80
730.95
730.28
720.28
688.75
1.0
736.72
734.00
734.00
734.00
747.00
734.00
734.00
731.15
730.48
720.48
688.95
1.2
736.92
734.20
734.20
734.20
747.20
734.20
734.20
731.35
730.68
720.68
689.15
1.4
737.12
734.40
734.40
734.40
747.40
734.40
734.40
731.55
730.88
720.88
689.35
1.6
737.32
734.60
734.60
734.60
747.60
734.60
734.60
731.75
731.08
721.08
689.55
1.8
737.52
734.80
734.80
734.80
747.80
734.80
734.80
731.95
731.28
721.28
689.75
2.0
737.72
735.00
735.00
735.00
748.00
735.00
735.00
732.15
731.48
721.48
689.95
2.2
737.92
735.20
735.20
735.20
748.20
735.20
735.20
732.35
731.68
721.68
690.15
2.4
738.12
735.40
735.40
735.40
748.40
735.40
735.40
732.55
731.88
721.88
690.35
2.6
738.32
735.60
735.60
735.60
748.60
735.60
735.60
732.75
732.08
722.08
690.55
2.8
738.52
735.80
735.80
735.80
748.80
735.80
735.80
732.95
732.28
722.28
690.75
3.0
738.72
736.00
736.00
736.00
749.00
736.00
736.00
733.15
732.48
722.48
690.95
3.2
738.92
736.20
736.20
736.20
749.20
736.20
736.20
733.35
732.68
722.68
691.15
3.4
739.12
736.40
736.40
736.40
749.40
736.40
736.40
733.55
732.88
722.88
691.35
3.6
739.32
736.60
736.60
736.60
749.60
736.60
736.60
733.75
733.08
723.08
691.55
3.8
739.52
736.80
736.80
736.80
749.80
736.80
736.80
733.95
733.28
723.28
691.75
4.0
739.72
737.00
737.00
737.00
750.00
737.00
737.00
734.15
733.48
723.48
691.95
4.2
739.92
737.20
737.20
737.20
750.20
737.20
737.20
734.35
733.68
723.68
692.15
4.4
740.12
737.40
737.40
737.40
750.40
737.40
737.40
734.55
733.88
723.88
692.35
4.6
740.32
737.60
737.60
737.60
750.60
737.60
737.60
734.75
734.08
724.08
692.55
4.8
740.52
737.80
737.80
737.80
750.80
737.80
737.80
734.95
734.28
724.28
692.75
5.0
740.72
738.00
738.00
738.00
751.00
738.00
738.00
735.15
734.48
724.48
692.95
5.2
740.92
738.20
738.20
738.20
751.20
738.20
738.20
735.35
734.68
724.68
693.15
5.4
741.12
738.40
738.40
738.40
751.40
738.40
738.40
735.55
734.88
724.88
693.35
5.6
741.32
738.60
738.60
738.60
751.60
738.60
738.60
735.75
735.08
725.08
693.55
5.8
741.52
738.80
738.80
738.80
751.80
738.80
738.80
735.95
735.28
725.28
693.75
6.0
741.72
739.00
739.00
739.00
752.00
739.00
739.00
736.15
735.48
725.48
693.95
6.2
741.92
739.20
739.20
739.20
752.20
739.20
739.20
736.35
735.68
725.68
694.15
6.4
742.12
739.40
739.40
739.40
752.40
739.40
739.40
736.55
735.88
725.88
694.35
6.6
742.32
739.60
739.60
739.60
752.60
739.60
739.60
736.75
736.08
726.08
694.55
6.8
742.52
739.80
739.80
739.80
752.80
739.80
739.80
736.95
736.28
726.28
694.75
7.0
742.72
740.00
740.00
740.00
753.00
740.00
740.00
737.15
736.48
726.48
694.95
7.2
742.92
740.20
740.20
740.20
753.20
740.20
740.20
737.35
736.68
726.68
695.15

OPERATION OF STRATTON AND ALGONQUIN DAMS
-27-
Fox
River at
New
Munster
Channel
Lake
near
Antioch
Fox
Lake
near
Lake
Villa
Nippers
ink
Lake at
Fox
Lake
Nippersi
nk
Creek
near
Spring
Grove
Fox
River at
Johnsbu
rg
Fox
River at
Stratton
Dam
(HW)
Fox
River at
Stratton
Dam
(TW)
Fox
River at
Algonqui
n Dam
(HW)
Fox
River at
Algonqu
in Dam
(TW)
Fox
River at
South
Elgin
Gage
Datum
735.72
733.00
733.00
733.00
746.00
733.00
733.00
730.15
729.48
719.48
687.95
Gage
Stage
Gage Elevation
7.4
743.12
740.40
740.40
740.40
753.40
740.40
740.40
737.55
736.88
726.88
695.35
7.6
743.32
740.60
740.60
740.60
753.60
740.60
740.60
737.75
737.08
727.08
695.55
7.8
743.52
740.80
740.80
740.80
753.80
740.80
740.80
737.95
737.28
727.28
695.75
8.0
743.72
741.00
741.00
741.00
754.00
741.00
741.00
738.15
737.48
727.48
695.95
8.2
743.92
741.20
741.20
741.20
754.20
741.20
741.20
738.35
737.68
727.68
696.15
8.4
744.12
741.40
741.40
741.40
754.40
741.40
741.40
738.55
737.88
727.88
696.35
8.6
744.32
741.60
741.60
741.60
754.60
741.60
741.60
738.75
738.08
728.08
696.55
8.8
744.52
741.80
741.80
741.80
754.80
741.80
741.80
738.95
738.28
728.28
696.75
9.0
744.72
742.00
742.00
742.00
755.00
742.00
742.00
739.15
738.48
728.48
696.95
9.2
744.92
742.20
742.20
742.20
755.20
742.20
742.20
739.35
738.68
728.68
697.15
9.4
745.12
742.40
742.40
742.40
755.40
742.40
742.40
739.55
738.88
728.88
697.35
9.6
745.32
742.60
742.60
742.60
755.60
742.60
742.60
739.75
739.08
729.08
697.55
9.8
745.52
742.80
742.80
742.80
755.80
742.80
742.80
739.95
739.28
729.28
697.75
10.0
745.72
743.00
743.00
743.00
756.00
743.00
743.00
740.15
739.48
729.48
697.95
10.2
745.92
743.20
743.20
743.20
756.20
743.20
743.20
740.35
739.68
729.68
698.15
10.4
746.12
743.40
743.40
743.40
756.40
743.40
743.40
740.55
739.88
729.88
698.35
10.6
746.32
743.60
743.60
743.60
756.60
743.60
743.60
740.75
740.08
730.08
698.55
10.8
746.52
743.80
743.80
743.80
756.80
743.80
743.80
740.95
740.28
730.28
698.75
11.0
746.72
744.00
744.00
744.00
757.00
744.00
744.00
741.15
740.48
730.48
698.95
11.2
746.92
744.20
744.20
744.20
757.20
744.20
744.20
741.35
740.68
730.68
699.15
11.4
747.12
744.40
744.40
744.40
757.40
744.40
744.40
741.55
740.88
730.88
699.35
11.6
747.32
744.60
744.60
744.60
757.60
744.60
744.60
741.75
741.08
731.08
699.55
11.8
747.52
744.80
744.80
744.80
757.80
744.80
744.80
741.95
741.28
731.28
699.75
12.0
747.72
745.00
745.00
745.00
758.00
745.00
745.00
742.15
741.48
731.48
699.95
12.2
747.92
745.20
745.20
745.20
758.20
745.20
745.20
742.35
741.68
731.68
700.15
12.4
748.12
745.40
745.40
745.40
758.40
745.40
745.40
742.55
741.88
731.88
700.35
12.6
748.32
745.60
745.60
745.60
758.60
745.60
745.60
742.75
742.08
732.08
700.55
12.8
748.52
745.80
745.80
745.80
758.80
745.80
745.80
742.95
742.28
732.28
700.75
13.0
748.72
746.00
746.00
746.00
759.00
746.00
746.00
743.15
742.48
732.48
700.95

OPERATION OF STRATTON AND ALGONQUIN DAMS
-28-
Figure 16: Gaging In Southern Portion of Watershed

OPERATION OF STRATTON AND ALGONQUIN DAMS
-29-
Figure 17: Gaging in Northern Portion of Watershed

OPERATION OF STRATTON AND ALGONQUIN DAMS
-30-
STRATTON AND ALGONQUIN OPERATIONS
Operations at Stratton Dam and Algonquin Dam are divided into four operational
periods: low flow, normal flow, flood warning, and flood flow. Figure 19 shows each of
the periods on flow duration curves for the Nippersink, New Munster, McHenry and
Algonquin gages.
Below an inflow of 390 cfs (known as Q
75
- 75 percent flow duration) operations are
considered to be low flow. From Q
75
to Q
25
(25 percent flow duration) operations are
considered to be normal flow. During periods of normal flow the operations at Stratton
Dam maintain outflow equal to inflow. This range of inflows is from 390 cfs to 960 cfs.
Inflows greater than 960 cfs are considered to be flood flows. There are three different
types of flood events at Stratton Dam. These are: 1) rainfall-snowmelt events when at
winter pool, 2) winter ice jams, and 3) rainfall events when at summer pool. Each of
these event types is outlined in the following text.
Important information to consider in flood operations is rainfall and runoff frequency
distributions. Listed in Table 8 are the 2 thru 100 year discharges for the Algonquin,
New Munster and Nippersink stream gages using the annual maximum series of
recorded discharges regardless of the season in which the discharge occurred.
Table 8: Annual Discharge Frequency Distributions for Select Gages
Gaging Station
Frequency (years)
2
5
10
25
50
100
Discharge (cfs)
Algonquin (1916-2007)
3268
4528
5307
6236
6891
7518
New Munster (1940-2007)*
2727
3906
4703
5729
6508
7301
Nippersink Creek (1960-2007)
1221
2002
2523
3168
3634
4086
* Gage at Wilmot until 1993

OPERATION OF STRATTON AND ALGONQUIN DAMS
-31-
10
100
1000
10000
1%10%100%
Flow Duration (% Time Exceeded)
Discharge (ft3/sec)
Fox River at McHenry
Nippersink Creek
Fox River at New Munster
Fox River at Algonquin
Normal Flow
Flood Warning
Flood Operations
Low
Flow
Figure 18: Flow Duration Curves

OPERATION OF STRATTON AND ALGONQUIN DAMS
-32-
Table 9 shows the seasonal rainfall frequency distributions for the 24-hour storm period,
for the northeast zone of Illinois (Huff, 1989). It is important to note the seasonal
difference in the rainfall amounts. The seasonal values are based on 1/4 of the total
statistical base and are therefore smaller than the annual values.
Table 9 Season Precipitation Frequency Distributions for 24-Hour Storm Period
and Recurrence Intervals of 2 to 100 Years
Season
Frequency (years)
2
5
10
25
50
100
Rainfall (inches)
Winter
1.09
1.44
1.79
2.26
2.65
3.18
Spring
1.92
2.39
2.82
3.53
4.13
4.85
Fall
1.92
2.55
3.12
4.04
4.80
5.74
Summer
2.61
3.34
4.07
5.18
6.20
7.43
Annual
3.04
3.80
4.47
5.51
6.46
7.58
RAINFALL SNOWMELT EVENTS AT WINTER POOL
The majority of the flooding events in the Fox watershed occur in the March, April, May
(spring) time period. Table 10 lists the months in which floods have occurred at the
Algonquin stream gaging station (1916-2010). Of the 119 storm events since 1916 that
have been greater than the two year event (3270 cfs) or the annual peak event if less
than two year event, 79 have occurred during the spring.

OPERATION OF STRATTON AND ALGONQUIN DAMS
-33-
Table 10: Months in which Flood Events have Occurred at the Algonquin Gage
(1916-2012)
Month
Number of
Events
Percent
Greatest
Peak
January
2
1.7%
3650
February
10
8.4%
5160
March
42
35.3%
5750
April
26
21.8%
6610
May
11
9.2%
6020
June
10
8.4%
6030
July
4
3.4%
5630
August
3
2.5%
6690
September
5
4.2%
4700
October
3
2.5%
6170
November
(1)
1
0.8%
1090
December
2
1.7%
5230
119
100.0%
6690
(1) No peaks occurred greater than 3000 cfs so the
highest monthly peak was used
Figure 19: Partial Duration Series for Algonquin Gage
0
1000
2000
3000
4000
5000
6000
7000
8000
Discharge (cfs)
Highest Peak of Month

OPERATION OF STRATTON AND ALGONQUIN DAMS
-34-
Figure 20: Partial Duration Series for Algonquin Gage (1916-2012)
(1) No peaks occurred greater than 3000 cfs so highest monthly peak was used
Most of the major events occur when the lakes are at a winter pool elevation of 735.5
feet (Fox Lake stage of 2.5 feet). At this elevation the maximum discharge at the dam if
the sluice gates are completely open is approximately 1650 cfs. This discharge is less
than the bankfull discharge of 2700 cfs and the no structural damage discharge of 3490
cfs. The hinged-crest gates at Stratton and Algonquin are most useful under these
conditions, because the storage both upstream and downstream of these two dams can
be optimized so the flood conditions upstream of these two dams can be lessened. An
additional 1200 cfs can be passed if the hinged crest gate at Stratton Dam is completely
open; this is a combined discharge of 2,850 cfs which is slightly higher than the bankfull
discharge of 2700 cfs.
WINTER OPERATIONS/ICE JAMS
At approximately the 2 year discharge of 3200 cfs, out-of-bank flooding begins in
Richardson Subdivision (Elevation 712.5) for open water conditions. With ice jams, this
stage is usually reached at a flow of 1100 cfs. The ice jams form during the first major
cold period of the winter before an ice cover on the river has formed. Ice jams also
occur after a warming trend has broken up the ice cover and an extreme cold period
again generates ice. The jam usually occurs when temperatures are below 20°F for
several days. As these temperatures occur, Figure 22 can be used with known
Algonquin discharges to estimate the flood stages at East Dundee. Daily
0
5
10
15
20
25
30
35
40
45
Number of Events
Number of Events Greater
than 3000 cfs

OPERATION OF STRATTON AND ALGONQUIN DAMS
-35-
communications, to monitor river stages, will be made with Kane County during these
freeze up periods.
When degree-freezing days accumulate to 60 or more, flows from Stratton and
Algonquin Dams are typically limited to approximately 1,000 cubic feet per second. For
example, if the daily average of the minimum and maximum temperature is 20°F., the
degree freezing days are 12 (32
o
– 20
o
= 12). This operational criterion was developed
from an engineering study performed by the U. S. Army Corps of Engineers, Cold
Regions Research Laboratory. The mean discharge at East Dundee for the winter
months of December, January, and February is 853 cfs, 723 cfs and 843 cfs
respectively (Knapp, 1988). Since that report was published in 1990, this office has
operated the Stratton Lock and Dam and Algonquin Dam by following the criteria to
minimize ice conditions on the lower river. This office has also worked with East and
West Dundee, the Kane County Forest Preserve District, Kane County, and the
residents of Richardson Subdivision to operate two ice booms for ten years to further
mitigate those ice conditions. The Carpentersville Ice Boom was first installed,
February 1, 1993. The East Dundee Ice Boom was first installed January 25, 1995.
Presently, the ice booms are not in operation. Increased ice jam hazards now exist and
the operation of Stratton Lock and Dam and Algonquin Dam cannot completely mitigate
the ice conditions.
Fluctuating the pool within the Chain of Lakes during winter conditions causes impacts
beyond the flood mitigation it provides. Ice forms at the level of the lakes, and as the
lake level rises and falls, shoreline stress is created. This impacts local shoreline
owners and the ecological habitat of the shorelines. Structural damage can occur to
steel shoreline walls and to docks as flows fluctuate. Perched ice increases the
hazards for recreational users of the Chain of Lakes. The void between the ice and
water poses danger to ice fishermen and snowmobilers. Also, local stormwater drainage
is inhibited when ice level is above normal summer pool.
Example of winter operations:
The weather conditions in early December of 2007 created high inflows to the Chain of
Lakes. Cold weather created conditions conducive to ice formation. After December 6,
2007, restricted outflows from Stratton Lock and Dam helped to minimize the threat of
ice jam flooding. On December 22, 2007, warm weather resulted in snow melt and the
Chain of Lakes received additional inflow and lake stages rose. Due to forecasts for the
return of cold weather, the outflows from Stratton Dam were restricted to those that
could be safely released considering possible ice conditions. The outflows were less
than the inflows and lake levels rose over 0.5 feet due to these conditions. Degree
freezing days accumulated to over 70 as of Jan. 3, 2008, and cold weather continued.
Flows at Algonquin were estimated at less than 1,100 cfs, the result of operations which
restricted outflows during cold weather. With predicted warm weather and resulting
increased runoff into the lakes, the lake levels were predicted to rise unless outflows
were increased; these increased outflows could have resulted in greater risks
downstream if cold weather returned. These conditions would have benefited from the
OPERATION OF STRATTON AND ALGONQUIN DAMS
-36-
ice booms which could have reduced the ice accumulation at the I-90 bridge and would
have extended the protection to Richardson Subdivision,

OPERATION OF STRATTON AND ALGONQUIN DAMS
-37-
Table 11: Ice Jams and Flood Flows
Water
Year
Date or
Frequency
Algonquin
Discharge
(cfs)
East Dundee
Elevation
with Ice jam
East Dundee
Elevation with
Ice Boom
East Dundee
Elevation with
Open Water
963
12/5/1962
253
709.44
1990
12/14/1989
359
710.10
1989
12/17/1988
464
710.70
1989
2/5/1989
510
712.50
1965
1/17/1965
582
712.78
1980
12/17/1979
600
710.95
1982
12/18/1981
750
712.57
1978
12/21/1977
834
710.53
1962
12/15/1961
868
712.70
1979
12/13/1978
912
713.09
1961
12/13/1960
932
711.50
1993
12/24/1992
1073
713.00
1975
1/17/1975
1200
711.67
1991
12/24/1990
1366
713.00
1981
12/20/1980
1460
714.05
1992
12/6/1990
1487
713.10
1984
12/18/1983
1610
713.31
1988
1/4/1988
1632
714.67
2010
1/4/2010
1780
e
714.9
1985
1/3/1985
1860
715.57
2009
1/9/2009
2267
n/a
1988
2/7/1988
2981
715.97
1994
12/28/1993
642
711.00
1995
12/12/1996
894
712.00
1995
1/29/1995
1100
711.70
1996
1/30/1996
1171
713.00
1998
1/14/1998
1920
712.60
1983
12/12/1982
3850
712.77
1 yr
3200
712.11
2 yr
4400
712.95
5 yr
5800
713.80
10 yr
5910
713.87
25 yr
7750
714.83
50 yr
8950
715.39
100 yr
10540
716.09
500 yr
13475
717.22
e – Estimated Flow
Carpentersville Ice Boom Installed February 1, 1993 thru November 2005
East Dundee Ice Boom Installed January 25, 1995 thru November 2005

OPERATION OF STRATTON AND ALGONQUIN DAMS
-38-
Figure 21: Ice Jams and Flood Flows
708.00
710.00
712.00
714.00
716.00
718.00
0 2000 4000 6000 8000 10000 12000
East Dundee Elevation (feet)
measured at foot bridge near East Dundee water treatment plant
Algonquin Discharge (cfs)
Open Water Flood
Ice Jams

RAINFALL EVENTS AT SUMMER POOL
Since the construction of the existing dam and gate structure at McHenry in 1939, 17
events greater than the 2 year flood have occurred while at summer pool. These events
are listed in Table 12.
Table 12: Summer Pool Flood Events since 1939
Peak Events greater than 2-year event
(3270 cfs) that occurred between May 1
and October 15 and after 1939 (when
dam was constructed)
Year
Month
Day
Algonquin
Dam
Average
Daily
Discharge
1967
6
17
3960
1972
9
24
4700
1973
5
4
5730
1986
10
3
6170
1996
5
23
4570
1999
6
18
4710
2000
6
17
5060
2001
6
17
3450
2002
6
7
3780
2004
5
31
6020
2007
8
26
6690
2008
5
13
3680
2008
6
19
5760
2008
7
24
3670
2009
5
4
3680
2010
5
16
4250
2010
8
1
3680
FISH LADDER OPERATIONS
The fish weir should be “open” and operational from mid-March through mid-August. As
water levels increase weir boards should be installed to maintain as smooth a transition
between pools as possible. OWR staff at the Stratton Lock and Dam will oversee
general operation and maintenance of the weir. IDNR Fisheries staff will assist with
opening and closing procedures (as needed) and periodically investigate fish use.
1. Placement of weir boards should allow for an equal rise from the lowest pool (#1
near the tailwater) to highest pool (#7 near the headwater). Rise between each
OPERATION OF STRATTON AND ALGONQUIN DAMS
-40-
pool should not exceed 6” to 8”.
2. Drain holes (also called turbulence holes) may need to be plugged during winter-
pool flows so water can accumulate in pools 7, 6, 5, 4 and 3.
3. Weir boards need to be adjusted so flows are equalized as the Chain of Lakes
fills toward summer pool.
4. At summer pool the “attractor tube” should be open to help draw fish toward the
weir. Prior to summer pool, flows through the attractor tube may be too low to
draw fish toward the weir. The attractor tube may be most functional when water
is flowing over the low head dam to the east of the fish weir.
5. At winter pool shut down water flows via a weir board at the headwater between
November and early March to reduce the likelihood of ice damage.
OPERATIONS MODELING
The Illinois State Water survey has completed three studies to help develop and
evaluate a flood control management policy for Stratton Dam (Knapp 1991 and Knapp
1992) and Stratton and Algonquin Dams (Knapp 1997). Two models were developed
for use in these evaluations: 1) a rainfall-runoff watershed model (PACE), and 2) an
unsteady flow-routing model (FEQ) to simulate the hydraulics of both the lakes and the
Fox River.
RAINFALL-RUNOFF MODEL
One of the major purposes of the rainfall-runoff model is for streamflow estimating using
a near real-time mode. Near real-time modeling uses input data from precipitation
events that have just recently occurred. The Fox River model typically uses rainfall
information from storms that occurred earlier in the day or on the previous day to
develop stream flow estimates. This is contrasted with real-time modeling, which
simulates the hydrologic response to a precipitation event immediately after its
occurrence.
Given the input of near real-time precipitation and temperature data, the model will
estimate streamflow conditions the current day and for up to six days into the future. In
addition to this near real-time estimating, the model can estimate future flows using a
rainfall prognosis as model input. For example, if the short-term meteorological forecast
calls for heavy rainfall over the watershed during the next 24 or 48 hours, the model can
estimate the effects of this potential (or hypothetical) rainfall on the streamflow. Potential
rainfall is used to assess potential impacts but gate operations are based on recorded
OPERATION OF STRATTON AND ALGONQUIN DAMS
-41-
rainfall only.
For the near real-time operation of the Fox River hydrologic model, the model user must
first compile the data that lists the amount of precipitation and air temperatures over the
watershed. Precipitation information can be obtained via the internet from the National
Weather Service or the United States Geological Survey. Currently, 21 gages, in or
near the Fox River watershed, provide this daily information. This information, along
with temperature data is manually entered into the rainfall-runoff model for processing.
The timeliness of the available precipitation information does not significantly impact
model accuracy, but it does determine how soon the streamflow can be estimated.
This, in turn, determines how soon Stratton Dam operators react to approaching flood
conditions, since the flow estimate provides the technical information needed for them
to modify the gate settings.
Since the development of the PACE rainfall-runoff model the National Weather Service
(NWS) has established a river forecast point for the Fox River at the New Munster,
Wisconsin gage. The forecast that is developed for the Fox River at this location is the
only river forecast point upstream of the Chain of Lakes. The forecast at this location
and the PACE model prediction are both evaluated in the determination of the
operations of the gates at Stratton Dam and Algonquin Dam.
UNSTEADY FLOW-ROUTING MODEL
In the simulation studies, the pool level is reduced by opening the gates to one of two
target discharge levels: 1) 1800 cfs, which is the maximum discharge for which no-
wake conditions can be maintained, and 2) up to 3000 cfs which is the maximum
discharge without overbank flooding. At the recreational pool level (737.00 feet), the
1800 cfs discharge is achieved by opening the sluice gates to a setting of 2.5 feet.
When the stage at Stratton Dam is more than one foot below the recreational pool level,
a gate opening of 3.0 feet may be required. The second discharge level (3000 cfs) is
achieved at normal pool (737.00) level when the sluice gates are opened wide.
The criterion for opening the gates to release 3000 cfs, described below, requires
relatively certain knowledge that severe (overbank) flooding is approaching the Chain of
Lakes. Releases from Stratton Dam are allowed to exceed the target discharges when
high stages in the lakes cause increasing amounts of uncontrolled flow over the Stratton
Dam spillway.
The following policy was chosen after analyzing: 1) the simulated impacts of using
various operation alternatives, 2) expected relationships between the flow predictions
and associated observed flows, and 3) the frequency at which the policy will be
employed.
OPERATION OF STRATTON AND ALGONQUIN DAMS
-42-
This flood control policy is designed so that the operation of the Stratton Dam gates
does not directly induce flooding downstream except when the flow prediction model
indicates the approach of extremely high flows (in which case the occurrence of
downstream flooding is almost certain). For lesser events, the policy keeps Stratton
Dam gate openings at a level (2.5 feet) that will allow unrestricted flow conditions to
continue, until that time when increasing stages at Stratton Dam create sufficient
uncontrolled flow over the spillway, thereby causing the total release to exceed the
maximum no-wake flow.
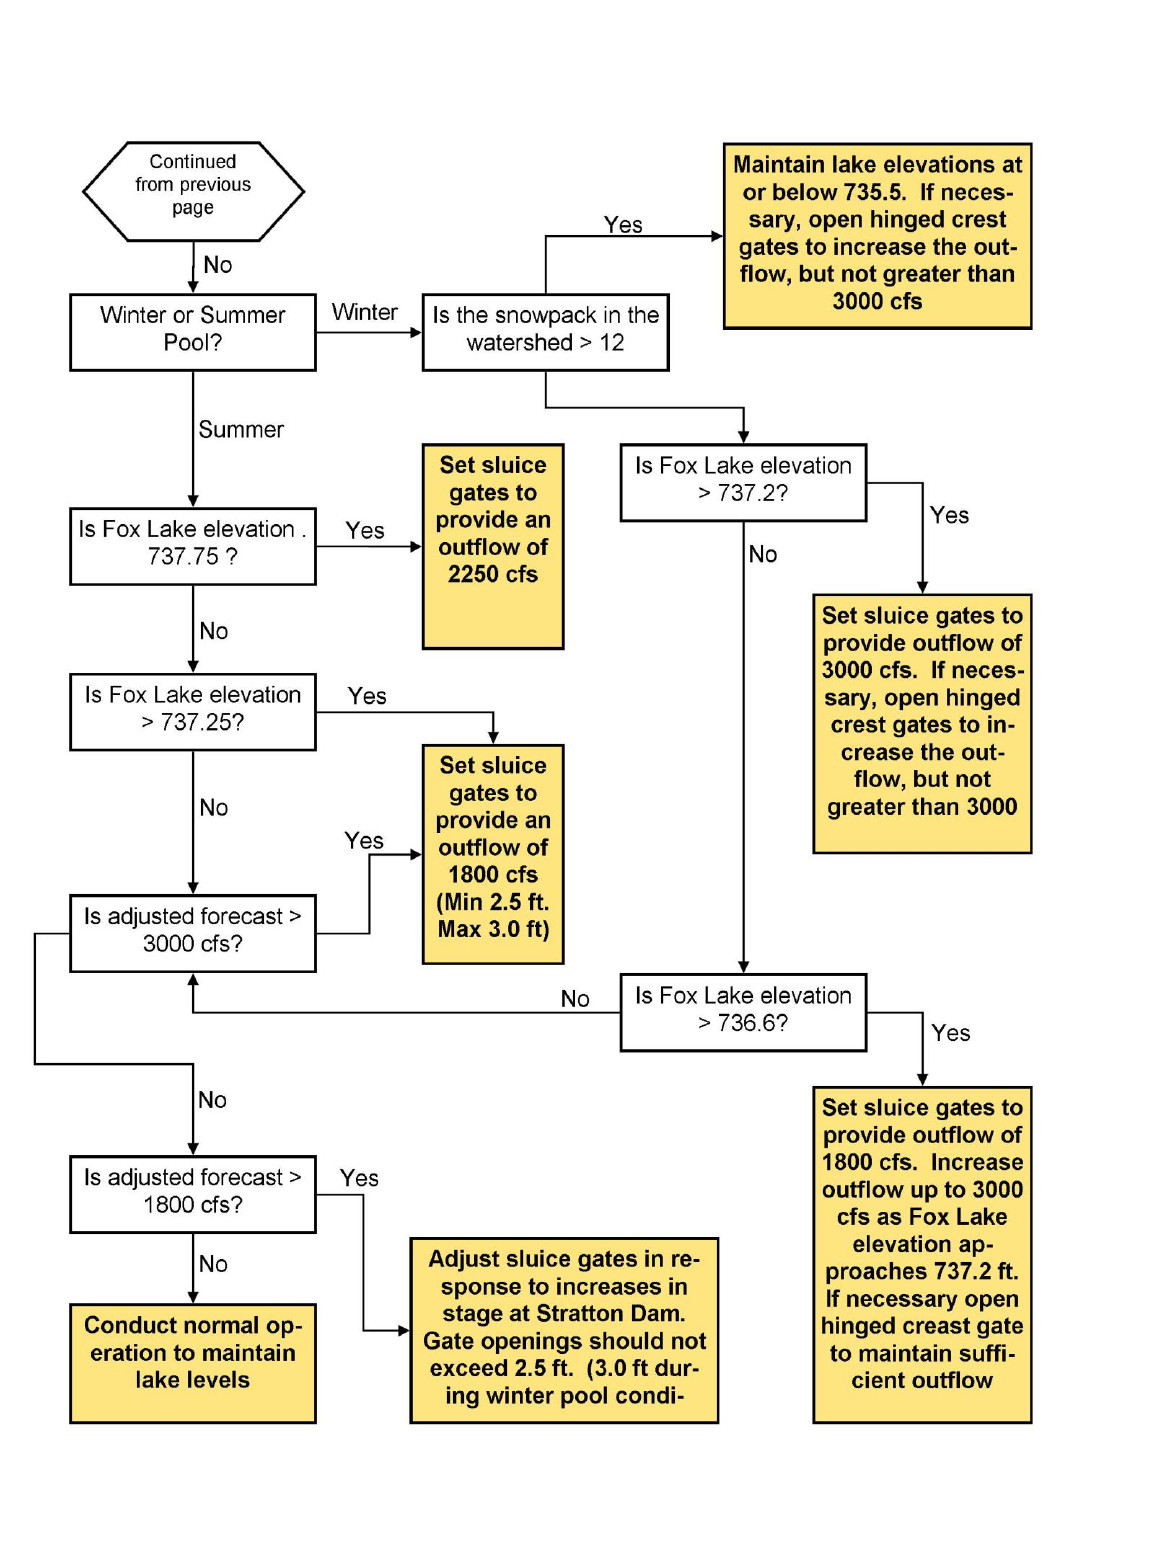
The flow chart showing the criteria for operating both the sluice gates at Stratton Dam
and hinged-crest gates at Stratton and Algonquin Dams is shown in Figure 23 (from
Figure 17, Knapp 1998). This flow chart is used both during a flood event and after a
flood event as a guide to operations. Additional information gathered during a flood
event such as the likelihood of ice jams forming or the flow conditions of downstream
tributaries may require deviations from the guidance of the flow chart in order to
minimize the overall flood potential of the Fox River. All predictions refer to predicted
inflows coming into the Chain of Lakes as calculated by the PACE model which include
the Fox River, Nippersink Creek, and all the ungaged tributaries. The data needed to
traverse the flow chart is a predicted value of the inflow to the Chain of Lakes from the
PACE model and the stage of Fox Lake at the time that the PACE model was executed.
The operation chart is not meant to be used with flow values from sources other than
the PACE model.
Important note: The development of the operation plan restricted the position of the
hinged crest gates to either closed or completely open. Additional flow measurements
made since the time of the operation plan development allows for the use of incremental
hinged crest gate openings to fine tune the performance of the system

OPERATION OF STRATTON AND ALGONQUIN DAMS
-43-
Figure 22: Flow Chart for
Flood Operations at
Stratton Dam
OPERATION OF STRATTON AND ALGONQUIN DAMS
-44-

OPERATION OF STRATTON AND ALGONQUIN DAMS
-45-
FLOOD WARNING PLAN
Flood prediction is the means by which local officials can estimate the occurrence of a
flood and foresee its impact on their community. This assessment of the potential
impact of a flood defines the nature of the response activities to be used in protecting
life and property. Once river stage predictions are available, local officials need to
assess the impact of the predicted stage on their community.
Four warning levels will be used along the Fox River. Each warning level is tied into a
river stage elevation which in turn corresponds to some expected degree of flooding in a
community.
Table 13: Flood Warning Stages along the Fox River
Location
Bank Full
Minor Flood
Mobilization
Major Flood
Elev.
Dis.
Elev.
Dis.
Elev.
Dis.
Elev.
Dis.
New Munster
741.0
3200
742.5
4700
743.0
5500
743.5
6200
Fox Lake
737.5
738.5
739.5
740.5
Johnsburg
737.0
738.0
739.0
740.0
Stratton Pool
737.0
3000
737.5
5200
738.0
5900
739.0
7500
Stratton
Tailwater
735.0
2900
736.0
4200
737.0
5500
738.0
6900
Algonquin
732.0
2500
733.0
6000
733.5
7100
734.0
8300
Carpentersville
722.5
2700
723.0
4200
723.5
5600
724.0
7400
East Dundee
712.0
2800
712.5
3600
713.0
4400
714.0
6200
OPERATION OF STRATTON AND ALGONQUIN DAMS
-46-
The four warning levels will be identified as bank full stage, minor flood stage,
mobilization stage, and major flood stage.
LEVEL 1 WARNING LEVEL
Bank full stage is defined as the river stage which equals the lowest riverbank elevation.
Initial flooding will occur in areas adjacent to the river, but will not result in damages to
property or a risk to the safety of residents.
LEVEL 2 WARNING LEVEL
Minor flood stage is defined as the river stage which results in the flooding of low-lying
agricultural and park lands, roads, and basements. Bank erosion may also occur as
may some minor damages.
LEVEL 3 WARNING LEVEL
Mobilization stage is defined as the river stage which results in low-level flooding of
homes and businesses. The problems caused by this flooding situation can be
adequately handled by local authorities with minimal assistance from State and Federal
agencies.
LEVEL 4 WARNING LEVEL
Major flood stage is defined as the river stage which results in significant flood damage
to public and private property and an increased risk to the safety of residents.
Evacuation of flooded areas is necessary under this level of flooding. Problems caused
by this level of flooding often overtax local resources, and Federal and State assistance
may become necessary.

OPERATION OF STRATTON AND ALGONQUIN DAMS
-47-
LOW FLOW OPERATIONS
Low flow operations follow the instream flow criteria discussed in "Instream Flow
Protection: A Planning Standard for Illinois Streams", developed by the State Water
Plan in 1983. When inflow is above 390 cfs the minimum release at Stratton Dam is
240 cfs. As the inflow drops below 390 cfs the release is then calculated as inflow plus
lowest flow expected for a 7-day period once in every ten years (Q
7,10
= 94 cfs) divided
by 2. The lowest gate setting at Stratton Dam is 0.10 foot with a discharge of 90.0 cfs
when the pool is at an elevation of 736.76 feet. In addition, during the summer months
when the lock is in operation there is an additional 8 to 10 cfs average daily discharge
downstream from lockage.
In equation form, the minimum outflow during low flows is:
2/)( 10,7QQinQ
OUT
2/)94( QinQ
OUT
Presently Aurora, Elgin and Fermi National Accelerator Laboratory are the major users
of Fox River water. Table 14 lists the average rate of withdrawal for these water users.
Table 14: Fox River Water Withdrawals
User
Average Rate of Withdrawal
(mgd)
(cfs)
Aurora
10.0
15.5
Elgin
14.0
21.7
Fermi Lab
1.0
1.5
Total
25.0
38.7
OPERATION OF STRATTON AND ALGONQUIN DAMS
-48-
TRANSITION TO SUMMER POOL
Almost all (85%) of the annual peak flood events occur as a result of snowmelt and
early spring rainfall. Historical streamflow data was reviewed from 1940 at Wilmot and
from 1916 at Algonquin to develop an operational plan for the transition from winter to
summer pool.
The first of May will remain the target date for summer pool (elevation 737) to coincide
with the opening of the locks to navigation. The lakes may be brought to summer pool
earlier if all the following criteria are met.
1. The inflow from the winter snow melt event has passed;
2. The inflow to the lakes has dropped below the annual mean inflow of 685 cfs
as measured at the New Munster (544 cfs) and Nippersink (141 cfs) gaging
stations;
3. When the mean inflow of 685 cfs is obtained, there must not be any
precipitation indicated on the National Weather Service 48-hour quantitative
precipitation forecast (QPF).
Once this criteria is met, transition to summer pool may proceed following the guidelines
given in "Instream Flow Protection: A Planning Standard for Illinois Streams." (Illinois
State Water Plan, 1983).
The inflow available for storage is the maximum value of either the streamflow minus
the 75% duration flow (Q
75
) or the difference of the streamflow minus the lowest flow
expected for a 7-day period once in every ten years (Q
7,10
), divided by two.
In equation form, the standard is:
Q
stream
- Q
75
Q
available
= Maximum of or
(Q
stream
- Q
7,10
)/2
The Q
75
inflow is 268 cfs measured at New Munster (185 cfs) and Nippersink (51 cfs).
The Q
7,10
inflow is 89 cfs measured again at New Munster (73 cfs) and Nippersink (16
cfs).
OPERATION OF STRATTON AND ALGONQUIN DAMS
-49-
WINTER DRAWDOWN
Winter drawdown at Stratton Dam starts on November 1 and continues to December 1
of each year. The normal drawdown is two feet below the crest of the spillway (736.76
feet), to an elevation of 734.76 at Stratton Dam. The resulting drawdown in the lakes is
normally about 18 inches as monitored at the lake stations with the lowest drawdown to
be at 735.5. The winter drawdown gives an additional 14,400 acre-ft of storage for flood
control in the Chain-O-Lakes as measured from a summer pool stage of 4.2 feet to a
winter drawdown stage of 2.5 feet.
On September 11, 1986, the Flood Control Advisory Committee of the Chain-O-Lakes
Fox River Waterway Management Agency, recommended that winter drawdown of the
Lakes area commence on the 15th day of October and reach normal winter water level
by the 15th day of November. It was the general opinion of the committee that this
change would minimize damage to the lower river area. Prior to this time the drawdown
ran from November first to December first. In 1992 at the request of the Chain-O-Lakes
Fox River Waterway Management Agency the winter drawdown was returned to
November first. Numerous complaints from people having problems navigating in the
waterway led to this return to the original drawdown dates.
The winter drawdown was re-investigated in 2011. Numerous requests were made
during the previous 5 years to change the winter drawdown, i.e. eliminate winter
drawdown or increase winter drawdown. The construction of the hinged crest gates
does not reduce the need for the winter drawdown. Winter drawdown provides flood
damage reduction benefits to numerous structures on the Chain of Lakes and Fox
River. Increasing the winter drawdown, lowering of the winter pool stage, would
increase these flood damage reduction benefits. However, there are environmental
impacts associated with winter drawdown.
Delaying winter drawdown has been requested several times. Climatological data for
the winters of 2000 – 2010 was reviewed. The 60° freezing days, the indicator of
potential ice jams where outflows from Stratton Dam should be reduced to 1000cfs to
minimize flooding, are reached by December 10 over 70% of the time. Therefore, the
reduction of stage in the Chain of Lakes needs to be accomplished before December
10. Shortening the time to accomplish winter drawdown risks the potential for shoreline
erosion. If an ice cover forms on the lakes before winter pool stage is reached,
potential damage to seawalls and piers could occur as the pool under the ice drops.
Inflows to the Chain of Lakes as measured at the Fox River near New Munster,
Wisconsin and Nippersink Creek near Spring Grove will be monitored during November.
Long range temperature and precipitation forecasts by the National Weather Service will
also be monitored. If inflows are below normal; temperatures are forecasted to be
above normal; and precipitation forecasted to be below normal delaying of the winter
OPERATION OF STRATTON AND ALGONQUIN DAMS
-50-
drawdown will be considered. The winter drawdown will be started on November 1 but
the drawdown would be completed at a slower rate to extend the completion into
December.
OPERATION OF STRATTON AND ALGONQUIN DAMS
-51-
EMERGENCY OPERATIONS DAM BREACH
As part of the dam safety analysis conducted in 1998 for the proposed hinged-crest
gates at Stratton and Algonquin Dams, a dam breach analysis was conducted for each
of the dams. Results of the dam breach analysis indicate that a breach of the Stratton
or Algonquin Dams will not increase the threat to life nor property damage. In the event
of a breach at either structure the flow conditions of the river will require monitoring just
as during any other flood period.
Both Stratton and Algonquin Dams are masonry (concrete) structures. Both structures
are relatively low in height with small storage upstream. The dam breach analysis
examined three different breach events: the Probable Maximum Precipitation (PMP),
100-Year, and Static (normal pool) event. A comparison was made between the natural
condition and the breach condition for each of the three events to determine changes in
the water surface elevations resulting from the breach. Table 15 shows the results of
the comparison of the peak stages from the simulated breach alternatives.
For the PMP and 100-year events there is very little impact downstream of the dams as
a result of the simulated breach. This can be explained by the fact that when the
simulation of the breach occurs the river channel and overbank areas are already
inundated by the flood waters and the river stage differential between the pool and
tailwater at the dams are minimal. In this respect, there is no increased threat to life or
substantial property damage.
Under the third scenario, each of the structures was breached at a normal pool stage.
Under these conditions the maximum difference exists between the pool and tailwater
stages. The simulated breaches cause increases in stage and discharge directly
downstream of each structure as the pool areas is drained. When Stratton Dam is
breached the change in the stage directly downstream was 1.43 feet. When Algonquin
Dam was breached the change in the stage directly downstream was 2.25 feet. In both
cases as the flood wave travels downstream its effects are attenuated. The increases
in stages generated by the breaches, has been reduced to 0.34 and 0.78 feet,
respectively by the time it reaches Carpentersville Dam.
The increase in maximum discharges from the simulated breaches under the normal
pool conditions at Stratton and Algonquin Dams coincide with flow rate equivalent to the
discharges which would be expected from between the normal two and five-year flood
events. Neither of these flood events poses a serious threat to life nor a risk of
substantial property damage. Conditions may warrant the restriction of boat traffic and
the possible closing of the river.

OPERATION OF STRATTON AND ALGONQUIN DAMS
-52-
Table 15: Dam Breach Analysis For Stratton And Algonquin Dams With Hinged
Crest Gates - Peak Stage

OPERATION OF STRATTON AND ALGONQUIN DAMS
-53-
LOCAL INPUT TO OPERATIONS
If a gate change is to be made, the Elgin Water Treatment Plant is contacted so that
they can make any needed operational changes due to changing flow rates. When
outflows from Stratton Dam are below 200 cfs Fermi National Accelerator Laboratory is
contacted.
PERMITS AND APPROVALS
This operation plan incorporates regulatory authorities and comments exercised by the
following:
Illinois Department of Natural Resources
Office of Water Resources permit for construction of hinged crest gates
Comprehensive Environmental Review Program
United States Army Corps of Engineers
Environmental Assessment for Hinged Crest Gates
Special Area Management Plan
Illinois Environmental Protection Agency
401 water quality review of hinged crest gates
RECENT IMPROVEMENTS TO OPERATIONS:
1. More frequent data from the New Munster gage in Wisconsin - we now collect
data every four hours instead of the 12 hour data collected previously.
(Completed in 2004)
2. The evaluation of radar estimates of rainfall over the watershed for use in
modeling predicted flows has been unsatisfactory. Some over estimation of
rainfall is currently being seen in the radar data. Incorporation of this information
into our watershed models requires additional work. (Published in 2006)
3. Discharge measurements made by the USGS have been used to develop
improved estimates of flow through the new Obermeyer gates. This gives us a
better understanding of the ability to move water out of the lakes, and whether
the downstream channel can handle the flow. (Published in 2009)
4. IDNR/OWR survey crews surveyed the depth of the river from Algonquin Dam to
Burton=s Bridge, and from Stratton Dam to the outlet of Pistakee Lake to
determine if siltation in the river is contributing to less flow capacity and more
OPERATION OF STRATTON AND ALGONQUIN DAMS
-54-
flooding, and how siltation may be affecting boating. A similar effort was
conducted in portions of the Chain of Lakes. (Completed in 2004)
5. Final USGS report for the rating equations for the control structures at Stratton
and Algonquin Dams published. The new equations were added to the database
which records water stages and calculates flow values. (Completed in 2010)
WORK YET TO BE PERFORMED:
1. Recalibration of the Fox River Prediction Model. This model is currently
calibrated based on old land use data compiled by Northeastern Illinois Planning
Commission in 1979 and daily average rainfall amounts. Updating the land use,
and incorporation of better measurements of actual rainfall will improve the
model.
2. Economic Impact Assessment - The assessment of flood damages to residential
and commercial structures, as well as an assessment of recreational use which
is impacted due to boating restrictions, will help to measure the positive and
negative effects of the present operating plan. This work is in-progress.
3. Winter Drawdown Analysis - This analysis has been requested by those who
believe the winter drawdown is environmentally damaging to the ecosystem of
the region. This includes impacts to shorelines, habitat, fisheries, and wetlands.
Such an analysis has been under discussion for some time, and efforts to move
the study along are hampered by the lack of staff and dollars. Additional
considerations for greater drawdown as well as an earlier drawdown have also
been requested.
4. Operational Plan Revisions - With improved data collection, improved models, a
better understanding of the positive and negative impacts of the present
operating plan, we can look to the development of a modified operating plan.
Specific modifications that have been requested include more proactive use of
the gates, re-looking at boating restrictions, and investigation of adjustments to
boundary constraints (flood prone structures, river capacity, etc.)
OPERATION OF STRATTON AND ALGONQUIN DAMS
-55-
REFERENCES
Department of Public Works and Buildings, Division of Waterways, 1938. Twenty-First
Annual Report of the Division of Waterways, July 1, 1937 to June 30, 1938.
Department of Transportation, Division of Water Resources, 1976. Fox River Dams
Study Report, 102 pp.
Fisk, Gregory G., 1988. Discharge Ratings for Control Structures at Stratton Dam on
the Fox River, Illinois; U.S. Geological Survey Water Resources Investigations Report
87-4226, 24 pp.
Healy, R.W., 1979. River Mileages and Drainage Areas for Illinois Streams - Volume 2,
Illinois River Basin, U.S. Geological Survey, Water Resources Investigation 79-111,
302pp.
Huff, Floyd A. and James R. Angel, 1989. Frequency Distributions and Hydroclimatic
Characteristics of Heavy Rainfalls in Illinois, Illinois State Water Survey, Bulletin 70,
177pp.
Knapp, H. Vernon, 1999. Fox River Basin Streamflow Assessment Model: 1999
Update to Hydrologic Analysis, Illinois State Water Survey Contract Report 649, 84 pp.
Knapp, H. Vernon and Terry W. Ortel, 1991. Hydrologic Modeling of the Fox River
Watershed, Illinois State Water Survey, Contract Report 518, 89pp.
Knapp, H. Vernon and Terry W. Ortel, 1992. Effect of Stratton Dam Operation on Flood
Control Along the Fox River and Fox Chain of Lakes, Illinois State Water Survey,
Contract Report 533, 79pp.
Knapp, H. Vernon, 1998. Influence of Streamflow Forecasts and Hydrometeorological
Conditions on Stratton Dam Operations, Illinois State Water Survey, Contract 635, 53pp
Kothandaraman, V., 1977. Fox Chain of Lakes Investigation and Water Quality
Management Plan, Cooperative Resources Report 5, Illinois State Water Survey, Illinois
State Geological Survey, 200pp.
Illinois State Water Plan Task Force, 1983. Instream Flow Protection: A Planning
Standard for Illinois Streams, Special Report No. 6, 28 pp.
Metcalf and Eddy, Inc., 1980. Improvements for Flood Control and Boating, Fox Chain
of Lakes and Fox River Lake, McHenry and Kane Counties Illinois, 121 pp.
OPERATION OF STRATTON AND ALGONQUIN DAMS
-56-
Straub, T.; Johnson, G.; Hortness,J.; and Parker, J., 2009, Control-Structure Ratings
on the Fox River at McHenry and Algonquin, Illinois, United States Geological Survey,
Scientific Investigations Report 2009-5186, 61 pp.
U.S. Army Corps of Engineers, Chicago District, 1984. Interim Report Fox River and
Tributaries Illinois, Draft Feasibility Report with Draft Environmental Impact Statement,
114 pp.
U.S. Army Corps of Engineers, Chicago District, 1984. Interim Report Fox River and
Tributaries Illinois, Supporting Documentation Technical Volume B. Hydrology and
Hydraulics.
U.S. Army Corps of Engineers, Chicago District, 1995. Fox River Illinois Stratton and
Algonquin Dams, Section 205 Addendum to the October 1989 Detailed Project Report.
Westcott, Nancy and H. Vernon Knapp, 2006. Evaluation of the Accuracy of Radar-
based Precipitation for Use in Flow Forecasting for the Fox Chain of Lakes, Illinois State
Water Survey, Contract Report 2006-005, 22pp.

