
Waste Reduction Model (WARM)
Data Quality Assessment Report
U.S. Environmental Protection Agency
Office of Land and Emergency Management
Office of Resource Conservation & Recovery
December 2023
EPA-530-R-23-016

WARM Data Quality Assessment 1
Acknowledgements
This WARM data quality assessment report was submitted to the U.S. Environmental Protection Agency,
Office of Resource Conservation and Recovery under Contract: EP‐W‐10‐056, Task Order
68HERH22F0274 by ICF Incorporated, L.L.C. This effort conducted by Deanna Lizas and her team at ICF.
Input and guidance were provided by Priscilla Halloran, Office of Land and Emergency Management,
Office of Resource Conservation and Recovery.

WARM Data Quality Assessment 2
Table of Contents
Acknowledgements ....................................................................................................................................... 1
Table of Contents .......................................................................................................................................... 2
Acronyms and Abbreviations ........................................................................................................................ 3
Executive Summary ....................................................................................................................................... 4
1. Introduction .......................................................................................................................................... 8
2. Approach ............................................................................................................................................. 10
3. Assessment of Material Datasets........................................................................................................ 15
3.1 Plastics and Bioplastics 16
3.2 Metals 19
3.3 Glass 24
3.4 Paper 26
3.5 Electronics 29
3.6 Construction Materials 32
3.7 Tires 45
3.8 Food Waste 48
3.9 Yard Trimmings 52
4. Assessment of Specific Management Pathway Datasets ................................................................... 54
4.1 Landfilling 54
4.2 Composting 56
4.3 Combustion 58
4.4 Anaerobic Digestion 61
5. Conclusion ........................................................................................................................................... 62
6. References .......................................................................................................................................... 64
Appendix: Data Quality Assessment Matrix ............................................................................................... 79

WARM Data Quality Assessment 3
Acronyms and Abbreviations
C&D Construction and demolition
DQ Data quality
DQA Data Quality Assessment
DQG Data Quality Goal
DQI Data Quality Indicator
DQS Data Quality System
EPA U.S. Environmental Protection Agency
GHG Greenhouse gas
HDPE High-density polyethylene
LCA Life Cycle Assessment
LCI Life Cycle Inventory
LDPE Low-density polyethylene
LLDPE Linear low-density polyethylene
MSW Municipal solid waste
ORD EPA Office of Research and Development
PET Polyethylene terephthalate
PP Polypropylene
PVC Polyvinyl chloride
WARM Waste Reduction Model

WARM Data Quality Assessment 4
Executive Summary
This report describes the findings from the detailed assessment of the quality of the data used to
develop the greenhouse gas (GHG) emission and energy factors in the U.S. Environmental Protection
Agency’s (EPA) Waste Reduction Model (WARM).
1
The purpose of this effort is to support EPA in
understanding and improving the data quality in WARM, and to provide additional transparency and
insight on the underlying data for WARM users. The report also offers recommendations for prioritizing
future updates.
This data quality assessment (DQA) involved a comprehensive review of the datasets used in the WARM
modeling for each material type and materials management pathway. The data quality for each data
source used to develop the WARM GHG emission and energy factors was evaluated for each of the flow
and process indicators described in EPA’s “Guidance on Data Quality Assessment for Life Cycle Inventory
Data” (Edelen and Ingwersen 2016). Flow indicators consider the reliability of the measurements, and
the correlation of the age of data, geographical coverage, and technological representativeness with the
study’s data quality goals. Process indicators consider the data review process used and the
completeness of the dataset.
The calculation of averages for each indicator grouping and for each material type and pathway
facilitated the assessment of the overall data quality for a material category or management pathway—
particularly across the large number of datasets and over 60 material types. Average scores were
translated into data quality levels, ranging from low to high. To give additional weight to the key data
sources driving emission and energy factor estimates for a material category, weighted average scores
also were calculated along with average scores.
1
Available at https://www.epa.gov/warm.
WARM Data Quality Assessment 5
Table 1 summarizes findings on data quality for the data quality indicator groupings by material category
and management pathway. The shading offers a big picture heat-map-like view of the data quality
findings with darker shading indicating higher data quality and lighter shading indicating lower data
quality. The report provides detail on these data quality results, and the Appendix: Data Quality
Assessment Matrix. This Appendix presents the scoring details in a matrix form by material,
management pathway, and dataset.

WARM Data Quality Assessment 6
Table 1: Summary of Data Quality Results by Material Type or Management Pathway
Material or Pathway
DQ Values by Indicator Grouping
Flow
Reliability
a
Flow
Represent-
ativeness
b
Process Review
and
Completeness
c
Average
d
Weighted
Average
e
Material Category
Plastics
Medium-high
Medium-high
Medium
Medium-high
Medium-high
Bioplastics
Medium-high
Medium
Medium-high
Medium-high
Medium-high
Metals
Medium
Medium
Medium
Medium
Medium
Glass
Medium
Medium
Medium
Medium
Medium-low
Paper
Medium-low
Medium
Medium-low
Medium-low
Medium
Electronics
Medium-high
Medium-high
Medium-high
Medium-high
Medium-high
Construction Materials
Medium-high
Medium-high
Medium-high
Medium-high
Medium-high
Asphalt Concrete
Medium-high
Medium
Medium-high
Medium-high
Medium
Asphalt Shingles
Medium-low
Medium
Medium
Medium
Medium
Carpet
Medium
Medium-low
Medium-low
Medium-low
Medium
Clay Bricks
Medium-high
Medium-high
High
Medium-high
High
Concrete
High
Medium-high
Medium
Medium-high
Medium-high
Dimensional Lumber
Medium-high
Medium-high
High
Medium-high
Medium-high
Drywall
Medium-high
Medium-high
Medium-high
Medium-high
Medium-high
Fiberglass Insulation
Medium
Medium
Medium
Medium
Medium
Fly Ash
Medium-high
Medium-high
Medium
Medium-high
Medium-high
Medium-density
Fiberboard
Medium-high
Medium-high
High
Medium-high
Medium-high
Structural Steel
Medium-high
Medium-high
Medium-high
Medium-high
Medium-high
Vinyl Flooring
Medium-high
Medium
Medium-high
Medium
Medium
Wood Flooring
Medium-high
Medium
Medium-high
Medium-high
Medium-high
Tires
Medium
Medium
Medium
Medium
Medium
Food Waste (non-meat)
Medium-high
Medium
Medium-high
Medium
Medium
Food Waste (meat)
Medium-high
Medium-high
Medium-high
Medium-high
Medium-high
Yard Trimmings
Medium-high
Medium-high
Medium-high
Medium-high
Medium-high
Management Pathway
f
Landfilling
Medium-high
Medium-high
Medium-high
Medium-high
Medium-high
Composting
Medium-high
Medium
High
Medium-high
Medium-high
Combustion
Medium
Medium-low
Medium
Medium
Medium
Anaerobic Digestion
Medium-high
Medium
Medium-high
Medium-high
Medium
a
Refers to data generation method and verification.
b
Includes temporal correlation (data year), geographical correlation (region of data), technological correlation (technology type,
scale), and data collection methods (representativeness, sample size).
c
Includes process review (third party or internal reviewers) and process completeness (percent of flows covered).
d
Average of all indicators.
e
Developed to give additional weight to the key data sources informing the emission factor estimates.
f
Separate data quality assessments for source reduction and recycling were not conducted as their data sources were already
captured under the material-specific data assessments.

WARM Data Quality Assessment 7
Key findings from this assessment include the following:
• Overall results: The average and weighted average
2
data quality levels for the WARM data
sources were assessed to be medium to medium-high for most material categories and
management pathways.
• Results by material category: Based on the weighted average of data quality results across the
indicators, medium-high data quality was found for plastics, bioplastics, electronics,
construction materials, food waste (meat), and yard trimmings; medium quality was found for
metals, paper, food waste (non-meat), and tires; and medium-low for glass. Within the
construction materials category, data quality results ranged from medium for asphalt concrete,
asphalt shingles, carpet, fiberglass insulation, and vinyl flooring to high data quality for bricks.
• Results by management pathway: Based on the weighted average of data quality results across
the indicators, medium-high data quality was found for landfilling and composting, and medium
for combustion and anaerobic digestion.
• Results by indicator: Process review and completeness generally had the highest data quality.
While several data sources had lower data quality for the temporal correlation indicator (a sub-
category of flow representativeness) due to age of data, this did not lead to low overall data
quality due to the other data quality considerations.
This assessment informed the following recommendations:
• Identify more recent data sources for select materials.
• Identify published data sources to update certain data inputs.
• Prioritize updates to the modeling of glass, paper, metals, food waste (non-meat), carpet,
asphalt shingles, fiberglass insulation, vinyl flooring, tires, and combustion.
• Improve the archiving and accessibility of the underlying data sources.
• Communicate the DQA findings alongside the WARM documentation.
2
Considers additional weighting for key data sources used in a particular category.

WARM Data Quality Assessment 8
1. Introduction
The U.S. Environmental Protection Agency’s (EPA) Waste Reduction Model (WARM) is a tool for
estimating the life-cycle greenhouse gas (GHG) emission, energy, and economic impacts of various
materials commonly found in municipal solid waste (MSW) under baseline and alternative waste
management scenarios. Currently, the model includes over 60 different materials and the materials
management pathways of source reduction, recycling, composting, combustion, landfilling, and
anaerobic digestion. EPA first developed WARM as a way to quantify the connection between waste
management practices and climate change, and to determine the potential for source reduction and
recycling of MSW to reduce GHG emissions. The first documentation report applying the WARM GHG
and energy factors, entitled Greenhouse Gas Emissions from Management of Selected Materials in
Municipal Solid Waste, was published in 1998. At the time, WARM included 17 material types commonly
found in MSW. Since then, EPA has expanded the model to include dozens of additional material types,
incorporated more sophisticated modeling of the management practice pathways, added the anaerobic
digestion pathway, quantified economic impacts, and made many other updates and improvements. In
addition, EPA organized the WARM documentation into chapters by material and pathway to provide
WARM users with detailed information about the specific materials analyzed in WARM and the
calculations behind the specific material emission, energy, and economic factors in the model. The
currently available online Excel version of the tool is version 15 available at epa.gov/warm.
WARM relies on numerous data sets for the development of material-specific GHG emission, energy,
and economic factors.
3
This report summarizes the detailed review of the data sources behind WARM
and an analysis of the quality of the data used to develop the emission and energy factors in the model.
The purpose of this effort is (a) to support EPA in understanding and improving upon the data quality in
WARM and prioritizing future updates, and (b) to provide additional transparency and insight on the
underlying data for WARM users. This effort is intended to shed light on areas for data quality
improvement, particularly across the numerous and diverse data sets used to develop WARM’s factors.
Importance of Data Quality to EPA
Data quality is critically important to EPA’s programs. Understanding and maintaining the quality of data
is a crucial aspect of the EPA’s scientific process, as outlined in the EPA Order CIO 2105.0 policy on
mandatory agency-wide quality systems (EPA 2000). EPA recognizes that low quality datasets or values
can in turn affect the integrity of values that rely on that data. Through a comprehensive assessment of
data quality, EPA seeks to advance the understanding of data quality, increase transparency, and
ultimately improve upon the data quality. Federal legislation is driving EPA and other federal agencies to
prioritize data accessibility. The Foundations for Evidence-Based Policymaking Act of 2018 mandates that
agencies such as the EPA improve the accessibility of data and use statistical evidence in the
development of policies and evaluation plans (H.R.4174 – 115
th
Congress 2017-2018). EPA implements
internal guidelines to guarantee the collection of data is done correctly and the quality of the data is
3
The methodology used to develop the WARM emission, energy, and economic factors is detailed in the WARM
Documentation, available at https://www.epa.gov/warm/documentation-waste-reduction-model-
warm#documentation.
WARM Data Quality Assessment 9
maintained. These regulations and guidelines exist to establish the credibility and trust of the
information produced by EPA and other federal agencies.
As part of the agency’s efforts to prioritize and carry-out data quality improvements, EPA has invested in
the development of guidance on data quality assessments and comprehensive evaluations of the quality
of data used in its analyses and programs. EPA’s Office of Research and Development (ORD) developed a
systematic methodology for data quality assessment (DQA) for life cycle inventory (LCI) data. This
approach is detailed in the “Guidance on Data Quality Assessment for Life Cycle Inventory Data” (ORD
Guidance) and discussed in further detail in the following Approach section (Edelen and Ingwersen
2016). Life cycle assessments (LCA), which evaluate environmental impacts across the life stages of a
material, product, or system, rely on many data inputs. LCA practitioners often use different
methodologies, tools, and approaches for documentation, and assessment of data quality can become
subjective. The ORD Guidance helps standardize the data quality review process to improve objectivity
in the scoring process, allowing for reproducibility of data quality scores, and improving understanding
of LCI data quality.
What is a Data Quality Assessment?
A data quality assessment (DQA) is a systematic review of a data source to determine its reliability and
level of quality as it relates to the goal and scope of the study or analysis. Rather than deeming a data
source good or bad, a DQA conducts a multi-pronged review based on several key analysis points. For
this DQA, each data source was reviewed based on several flow and process indicators. Flow indicators
consider the reliability of the measurements, and the correlation of the age of data, geographical
coverage, and technological representativeness with the study’s data quality goals (DQGs). Process
indicators consider the data review process used and the completeness of the dataset. As noted in the
ORD Guidance, the goal of a DQA with the use of a pedigree matrix scoring approach is to “see where
potential data quality issues might exist within large datasets and/or models with multiple processes”
(Edelen and Ingwersen 2016).
In understanding the results from a DQA, it is important to recognize a few key elements:
• Certain data quality results are static, while others are dynamic. Reliability of the data, based on
how the data were developed, is a static, unchanging, data quality element. Temporal
correlation is a dynamic data quality element that will change depending on a user’s timeframe
of study and the strength of a dataset’s correlation will change with the passing of time.
• A DQA may not capture all data sources or all data quality elements. Certain data may be
unavailable or inaccessible. Other data may be unknown to a data developer or may not be
possible to quantify.
• The user dimension is an important piece of how data quality results are interpreted. The data
quality can help inform how data are used by a particular user or for a specific purpose (e.g., for
certain uses or applications, a lower data quality dataset may be sufficient). In addition, while a
data developer is responsible for documenting and clearly communicating data quality
elements, a data user is responsible for assessing the appropriateness of the applications and
uses of the data.

WARM Data Quality Assessment 10
In the case of WARM, users of the tool and the emission and energy factors need to be aware that the
development of the factors includes multiple data sources and assumptions. This report describes the
data sources and assesses the quality of each of the data sets, to the extent feasible. A concerted
attempt was made to include all known data sources used for the emission and energy factor
development. The WARM documentation chapters
4
provide additional detail on the data sources and
discuss the boundaries of the analysis, the methodologies used to develop the factors, and limitations
related to the modeling of the emissions and energy use for the various material categories and
management practices.
The remainder of this report is organized as follows:
• Section 2: Approach
• Section 3: Assessment of Material Datasets
• Section 4: Assessment of Specific Management Pathway Datasets
• Section 5Error! Reference source not found.: Error! Reference source not found.Conclusion
• References
• Appendix: Data Quality Assessment Matrix
2. Approach
The scope of this assessment focused on the data used to develop the greenhouse gas (GHG) emission
and energy factors in EPA’s Waste Reduction Model (WARM). The factors are built with life-cycle
inventory and assessment data from various sources with a focus on prioritizing publicly available, peer-
reviewed reports, literature, and databases. The approach used for the data quality assessment (DQA)
follows that described in the “Guidance on Data Quality Assessment for Life Cycle Inventory Data”
developed by EPA’s Office of Research and Development (ORD Guidance) (Edelen and Ingwersen 2016).
The ORD Guidance specifies data review elements at the flow and process levels. The flow level
indicators cover reliability and representativeness of the data, and the process level indicators cover the
review process and completeness of the dataset.
The ORD Guidance provides data quality indicators (DQIs) to accurately assess the “functionality of data
within the boundaries of a particular study or project goal and scope” for life cycle inventory (LCI) data.
The guidance not only provides detailed information on the relevance and applicability of each
identified DQI, but also provides direction for developing a pedigree matrix data quality system (DQS)
with objective and clear scoring parameters. The DQA process involves scoring of five flow indicators
and two process indicators, as described in Table 2.
4
Available at https://www.epa.gov/warm.

WARM Data Quality Assessment 11
Table 2: Indicators Used for Assessing and Scoring the Quality of Data Sources
Indicator
Description
Flow Indicators
Flow Reliability
Used for reviewing if measurements and calculations in a source are verified and
reliable.
Temporal Correlation
Used for measuring the age difference between the temporal data quality goal
(DQG) and the data generation date in a source.
Geographical Correlation
Used for reviewing the relationship between the geographical DQG and the area
of study in a source.
Technological Correlation
Used for reviewing the relationship between the technological DQG and the
technological approach in a source. There are four categories of technological
representativeness reviewed by this indicator: process design, operating
conditions, material quality, and process scale. More information on these
categories can be found in the Appendix.
Data Collection Methods/
Representativeness
Used for identifying if a significant percentage of the relevant market share of an
industry is covered over an adequate time period by a source.
Process Indicators
Process Review
Used for identifying if a source has been reviewed by adequate third-party
reviewers and if proper documentation of the review accompanies the data in a
source.
Process Completeness
Used for identifying the percentage of flows determined for a process that has
been evaluated and assigned a value in a source.
The scoring for each indicator, as described in the ORD Guidance, ranges from 1-5 with the lowest score,
1, representing the highest quality data. A lower cumulative score or average score of all indicators
represents a data source with high quality data and methodology, whereas a higher score indicates
poorer data quality. The Data Quality Pedigree Matrix with the scoring range descriptions for each flow
and process DQI from the ORD Guidance is presented in Table 3.

WARM Data Quality Assessment 12
Table 3: Data Quality Pedigree Matrix for Flow and Process Indicators
Highest data quality
Lowest data quality
Indicator
1
2
3
4
5
Flow Indicators
Flow Reliability
Verified data based
on measurements
a
Verified data based
on a calculation or
non-verified data
based on
measurements
Non-verified data
based on a
calculation
Documented
estimate
Undocumented
estimate
Flow Representativeness
Temporal
Correlation
Less than 3 years of
difference
b
3 to 6 years of
difference
Less than 10 years
of difference
Less than 15 years
of difference
Age of data
unknown or more
than 15 years
Geographical
Correlation
c
Data from same
resolution and
same area of study
Within one level of
resolution and a
related area of
study
Within two levels
of resolution and a
related area of
study
Outside of two
levels of resolution
but a related area
of study
From a different or
unknown area of
study
Technological
Correlation
d
All technology
categories are
equivalent
Three of the
technology
categories are
equivalent
Two of the
technology
categories are
equivalent
One of the
technology
categories is
equivalent
None of the
technology
categories are
equivalent
Data Collection
Methods
Representative
data from >80% of
the relevant
market
e
, over an
adequate period of
time
f
Representative
data from 60-79%
of the relevant
market, over an
adequate period or
representative of
data from >80% of
the relevant
market, over a
shorter period of
time
Representative
data from 40-59%
of the relevant
market, over an
adequate period of
time or
representative
data from 60-79%
of the relevant
market, over a
shorter period of
time
Representative
data from <40% of
the relevant
market, over an
adequate period of
time or
representative
data from 50-59%
of the relevant
market, over a
shorter period of
time
Unknown or data
from a small
number of sites
and from shorter
periods
Process Indicators
Process Review
Documented
reviews by a
minimum of two
types
g
of third-
party reviewers
Documented
reviews by a
minimum of two
types of reviewers,
with one being a
third party
Documented
review by a third-
party reviewer
Documented
review by an
internal reviewer
No documented
review
Process Completeness
>80% of
determined flows
have been
evaluated and
given a value
60-79% of
determined flows
have been
evaluated and
given a value
40-59% of
determined flows
have been
evaluated and
given a value
<40% of
determined flows
have been
evaluated and
given a value
Process
completeness not
scored
a
Verification may take place in several ways, e.g., by on-site checking, by recalculation, through mass balances or cross checks with other
sources. For values calculated from a mass balance or another verification method, an independent verification method must be used to
qualify the value as verified.
b
Temporal difference refers to the difference between date of data generation and the date of representativeness as defined by the scope of
the project.
c
Geographical representativeness for this study set is based on EPA data quality goals of national data 1: U.S. data, national in scope; 2: U.S.
data, state or local level in scope; 3: North American data; 4: Global data; 5: Unknown location of data.
d
Technological categories are process design, operating conditions, material quality, and process scale.
e
The relevant market should be documented in the DQG. The default relevant market is measured in production units. If the relevant market
is determined using other units, this should be documented in the DQG. The relevant market established in the metadata should be
consistently applied to all flows within the unit.
f
Adequate time period can be evaluated as a time period long enough to even out normal fluctuations. The default time period is 1 year,
except for emerging technologies (2-6 months) or agricultural projects >3 years.
g
Types are defined as either industry or LCA experts.

WARM Data Quality Assessment 13
Following the ORD Guidance and using the DQIs described above, this assessment involved the following
steps:
➢ Step 1: Review of WARM DQGs: To ensure a systematic review of the various datasets, the process
began with a review of the DQGs for an ideal WARM dataset as they align with the various DQIs.
These WARM DQGs are outlined in Error! Reference source not found. below:
Table 4: WARM Data Quality Goals Aligned to the Indicators
Indicator
WARM Goal
Flow Indicators
Flow Reliability
Documented data are ideally verified by in-person authentication or
repeatable calculation measurements.
Flow Representativeness
Temporal Correlation
Temporal correlation with data collected, measured, or estimated as
recent as possible to the present without compromising in the other data
quality areas.
Geographical Correlation
Data represent U.S. conditions at the national level.
Technological Correlation
Strong technological correlation to the process or technology addressed
for each material or management pathway, with clear information on
inputs. Studies should ideally reflect the current processes employed by
the market.
Data Collection Methods
Representative of the majority of the market over a reasonable period of
time to avoid outlying data, ideally within one year.
Process Indicators
Process Review
Data are reviewed by at least one third-party reviewer, ideally multiple.
Process Completeness
Majority of the determined flows evaluated in the LCI datasets.
➢ Step 2: Creation of a DQA Review Matrix: A comprehensive data quality review matrix in Excel
covering the DQIs within the ORD Guidance was created and used to review each dataset in a
systematic way.
➢ Step 3: Identification of Data Elements and References: Multiple data sources are used to develop
the emission and energy factors for each material type in WARM. For this DQA effort, each material
type and management pathway in WARM, the key unit process data elements and corresponding
data sources and source years were identified. To do so, each source referenced in the WARM
documentation and emission and energy factor calculations spreadsheet used to develop the latest
version of WARM was included in the DQA review matrix.
➢ Step 4: Collection of the Data Sources: The ORD Guidance describes the importance of using and
assessing the original documentation. The original data sources for each data element as referenced
in the WARM documentation were identified and gathered to the extent feasible within archives. As
part of this effort, a comprehensive archive of the underlying data resources by material category
and end-of-life pathway was created. A few sources for specific material types and management
pathways could not be located, particularly documentation of prior conversations with industry
experts. These sources were given the lowest data quality scores.

WARM Data Quality Assessment 14
➢ Step 5: Review of Data Sources and Scoring Assessment of Data Quality: The gathered data sources
were reviewed against the different DQIs and the data quality findings were noted. For each data
source, each indicator was scored based on the ORD Guidance criteria in Table 3 and the totals
across the indicators were summed to obtain a total score, ranging from 7 (highest quality) to 35
(lowest quality). The average across the indicators was also taken and ranged from 1 to 5. For an
example of this process, a plastic data source received the scores shown in Table 5 for the five flow
indicators and two process indicators, which sum to the total score of 16 and average to 2.3.
Table 5: Example of DQ Scoring Assessment for a Single Data Source
Flow Indicators
Process Indicators
Total
Score
Average
Score
Flow Reliability
Flow representativeness
Process
Review
Process
Completeness
Temporal
correlation
Geographical
correlation
Technological
correlation
Data collection
methods
Data generation
method &
verification
Data year
Region of
data
Technology
type, scale
Representativeness,
sample size
Third party
or internal
reviewer(s)
% of flows
covered
1
5
1
2
1
5
1
16
2.3
To give additional weight to the key data sources driving emission and energy factor estimates for a
material category, a weighted average score was calculated along with an average score. While the
average score takes the total score for all data sources and divides by the number of sources for
each material type, the weighted average redistributes the weight of each study’s score based on
whether the data source is a driving factor in overall emissions. For example, a source was generally
considered key if it impacts several materials within a category, is a lead source in process emission
estimates, or is comprehensive enough to be used throughout the life cycle of a material’s emission
estimates. In the weighted average score, key sources were given double the weight of other, non-
key sources.
➢ Step 6: Alignment of Scores with Data Quality Levels: Across multiple data sources for a material
category or pathway, the averages for high level indicators of flow reliability, flow
representativeness, and process review and completeness were taken and used to develop average
data quality values across that material category or pathway. The averaged data quality values were
aligned with data quality levels from low to high as shown in Table 6. To present the results in a
more visual way, a shading system was applied to the scores where pale blue was assigned to the
lowest data quality level with an average data quality value of one and dark blue was assigned to the
highest data quality level corresponding with an average data quality value of five. Between those
data quality levels and values the shading scales from light blue for low data quality to dark blue for
high data quality. In the case of the example data source above, the average score of 2.3 aligned
with a data quality level of medium-high.

WARM Data Quality Assessment 15
Table 6: Alignment of Average Data Quality Values with Data Quality Levels
Average DQ Value
DQ Levels
1
High
2
Medium-high
3
Medium
4
Medium-low
5
Low
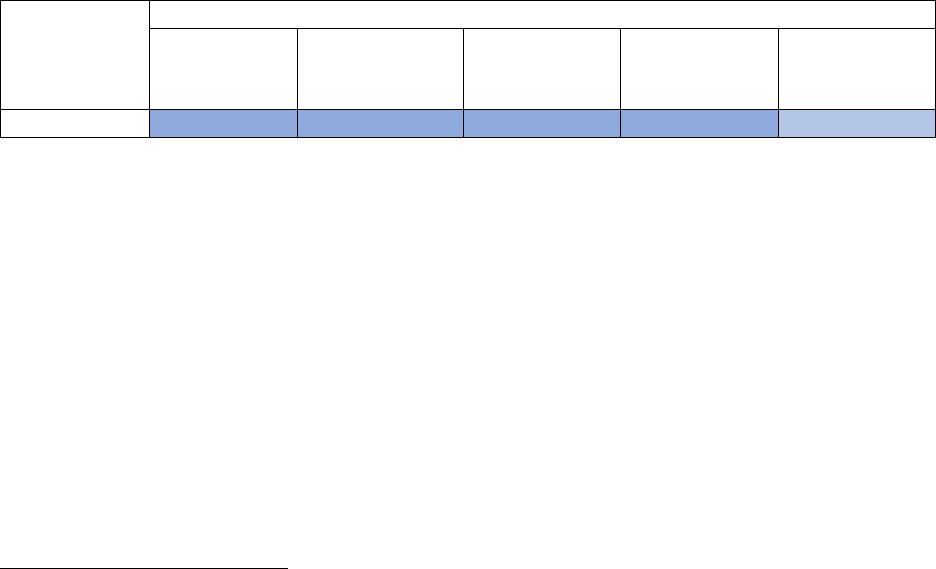
➢ Step 7: Assessment of Results: Based on the scoring assessment, the resulting matrix was organized
into the categories – high, medium-high, medium, medium-low, and low data quality scores. For
each material category and management pathway the following summary table is presented in the
sections that follow.
Management
Pathway
DQ Values by Indicator Grouping
Flow
Reliability
a
Flow
Represent-
ativeness
b
Process
Review and
Completeness
c
Average
d
Weighted
Average
e
a
Refers to data generation method and verification.
b
Includes temporal correlation (data year), geographical correlation (region of data), technological correlation (technology type,
scale), and data collection methods (representativeness, sample size).
c
Includes process review (third party or internal reviewers) and process completeness (percent of flows covered).
d
Average of all indicators.
e
Developed to give additional weight to the key data sources informing the emission factor estimates.
The materials or pathways with datasets receiving the lowest data quality scores and the indicators
contributing to those scores were identified and will require closer examination to inform
prioritization of future WARM updates.
➢ Step 8: Preparation of Findings and Recommendations: This report was developed to summarize
key findings, areas for improvement, and recommendations for addressing WARM’s data quality.
Weighted averages were calculated to provide additional context to the reader and give a deeper
view into how different data sources were used. These weighted averages could also be used in the
future to help prioritize updates to source materials.
3. Assessment of Material Datasets
The following sections present the results from the assessment of the quality of the datasets and data
sources by material category (e.g., metals) and type (e.g., aluminum cans). Summaries of key findings
are presented followed by recommended areas for further research and improvement of the data
quality. In the discussion of data sources, key sources used in the development of the emission and
energy factors are noted as (KEY). They are weighted more heavily for the development of the weighted
averages. Additional details on the scoring results from the assessment of the flow level and process
level indicators for each material data source are presented in the Appendix: Data Quality Assessment
Matrix.

WARM Data Quality Assessment 16
3.1 Plastics and Bioplastics
Summary of Key Findings
Data Sources. WARM includes emission and energy factors for seven plastic resins—high-density
polyethylene (HDPE), low-density polyethylene (LDPE), polyethylene terephthalate (PET), linear low-
density polyethylene (LLDPE), polypropylene (PP), general purpose polystyrene (GPPS), and polyvinyl
chloride (PVC)—a mixed plastics category, and the bioplastic, polylactide (PLA) biopolymer resin. The
development of the factors relied on the use of both key sources and additional sources, as described
below.
The primary data sources used to develop the fossil-based plastic resin factors include:
• The Life-Cycle Inventory (LCI) report, Cradle-to-Gate Life Cycle Inventory of Nine Plastic Resins
and Four Polyurethane Precursors (FAL 2011), which provides raw material acquisition and
manufacturing energy data for the production of the virgin plastic resins HDPE, LDPE, PET,
LLDPE, PP, GPPS, and PVC. This report presents a cradle-to-gate LCI quantifying the total energy
requirements, energy sources, atmospheric pollutants, waterborne pollutants, and solid waste
resulting from the production of nine plastic resins produced in North America. (KEY)
• The LCI report, Life Cycle Impacts for Postconsumer Recycled Resins: PET, HDPE, and PP (FAL
2018), which provides process energy data for the production of recycled plastics resins HDPE,
PET, and PP. This report presents a cradle-to-gate life cycle analysis quantifying total emissions
from the production of recycled HDPE, PET, and PP resins in North America. (KEY)
The bioplastics factors rely largely on two primary data sources:
• The NatureWorks U.S. LCI spreadsheet entitled “SS Polylactide Biopolymer Resin_US LCI
May_2010.xls” submitted to the U.S. LCI Database
5
(U.S. LCI 2010). It provides raw material
acquisition and manufacturing energy data for the production of Ingeo PLA resin. Although this
source reflects PLA resin production by NatureWorks LLC in Blair, Nebraska, it is considered
representative of U.S. PLA production due to the absence of direct competitors to NatureWorks
operating a fully industrial-scale PLA manufacturing plant in the United States. (KEY)
• Responses from NatureWorks on ICF’s preliminary review of the NatureWorks PLA LCI Data
Memo (NatureWorks 2010). The responses include updated data for net atmospheric CO
2
uptake during corn production, landfill carbon storage, and PLA carbon content. (KEY)
Transportation-related information was obtained from the following data sources:
• For all plastics resins and bioplastics: US Census Commodity Flow Survey Preliminary Tables,
Table 1: Shipment Characteristics by Mode of Transportation for the United States (BTS 2013).
This source is a Commodity Flow Survey (CFS) on domestic freight shipments developed jointly
5
U.S. Life Cycle Inventory Database | NREL, https://www.nrel.gov/lci/

WARM Data Quality Assessment 17
by the Bureau of Transportation Services (BTS), the U.S. Census Bureau, and U.S. Department of
Commerce. It provides data on retail transportation distance and fuel-type.
• For bioplastics: The Role of Recycling in Integrated Solid Waste Management to the Year 2000
(FAL 1994). This report is a study on the role of recycling in integrated solid waste management
published by Franklin Associates and provides data on transportation energy use.
• For bioplastics: Evaluation of Climate, Energy, and Soils Impacts of Selected Food Discards
Management Systems (Oregon Department of Environmental Quality [DEQ] 2014). This report
evaluates the environmental and energy impacts of specific food discards management systems
and provides data on transportation emissions. The transportation emissions data from this
report are used for bioplastics.
Scoring. The average DQA scores for plastics and bioplastics varied within the medium to medium-high
data quality levels. A summary of the results by data quality indicator grouping for plastics and
bioplastics is shown in Table 7. The key findings for each of the sources used for plastics and bioplastics
are discussed below.
Table 7: Summary of Data Quality Results for Plastics and Bioplastics Data Sources
Material
DQ Values by Indicator Grouping
Flow Reliability
Flow
Represent-
ativeness
Process Review
and
Completeness
Average
Weighted
Average
Plastics
Medium-high
Medium-high
Medium
Medium-high
Medium-high
Bioplastics
Medium-high
Medium
Medium-high
Medium-high
Medium-high
Note: For details on the indicator subcategories for each indicator grouping, see Section 2: Approach.
Plastics
The medium-high data quality average and weighted average for the fossil-based plastic resins was
largely a consequence of the data from the virgin plastic resin LCI report (FAL 2011) reflecting medium-
high and high data quality for most flows and process indicators. The exception for that data source is
the process review indicator (a sub-category of the process review and completeness indicators), which
was deemed low quality due to lack of information on external reviews in that report and temporal
correlation (a sub-category of the flow representativeness indicator), which reflects medium-low data
quality due to the data used in FAL (2011) being representative of 2003 or earlier. The recycled plastic
resin LCI report (FAL 2018) was classified as medium to high data quality across the indicators as it
covers over 80 percent of processes in North America related to the emissions of recycling plastics, with
a representative data pool and documented calculation. The Role of Recycling Report (FAL 1994), which
provides general transportation equipment information, was determined to be of medium-high data
quality as it characterizes a majority of the municipal solid waste in the United States at the time, uses
calculated data, and covers a wide scope of technologies, including vehicle type, vehicle load, and
material type to inform data on transportation equipment. However, FAL (1994) is not a higher data
quality source due to low quality temporal correlation as the data were collected in 1992. This likely
impacts the validity of the data as transportation technology has changed since 1992. The Commodity
Flow Survey (BTS 2013) reflects medium data quality overall, as it was characterized as medium-low
data quality for temporal correlation and process review due to data that are over 10 years old and a
WARM Data Quality Assessment 18
lack of information on external reviews. The source also reflected low data quality for process
completeness (sub-category of process review and completeness indicators).
The plastic data sources generally reflect high data quality for flow reliability, geographical correlation,
and data collection (sub-categories of the flow representativeness indicators), and process
completeness indicators. However, the plastic data sources reflect low data quality for the temporal
correlation indicator (sub-category of the flow representativeness indicators) and process review
indicator. The mixed plastics material type in WARM is the average of the emission factors developed
for the plastic resins. Therefore, the average plastics data quality scoring was applied to assess the
“mixed plastics” material category.
Bioplastics
For bioplastics, the NatureWorks LCI dataset (U.S. LCI 2010) was characterized as having medium-high to
high data quality across the indicators, with the exception of the temporal correlation indicator, which
reflected medium-low quality. The additional NatureWorks source (Vink 2010) is of medium-high data
quality overall, as it was deemed high quality across most indicators, but low data quality for temporal
correlation and process review completeness (sub-category of process review and completeness
indicators) as it is a relatively old source and lacks documentation of external reviews. The data quality
of the additional data sources—BTS (2013), FAL (1994), Oregon DEQ (2014)—used for the PLA emission
and energy factors are described above under plastics.
Overall, the plastics datasets scored as follows:
• Average indicator: Medium-high
• Average weighted indicator: Medium-high
Overall, the bioplastics datasets scored as follows:
• Average indicator: Medium-high
• Average weighted indicator: Medium-high
Recommendations
Areas for improvement include:
• Identify and incorporate an additional source for raw material acquisition and manufacturing energy
data for the production of virgin plastic resins that has two or more types of documented third-party
reviews. The current source, FAL (2011), that provides process energy data for all virgin plastic resins
does not have any documented third-party reviews.
• Identify and incorporate an additional source for plastics with process data for production of
additional recycled plastic resins (i.e., LDPE, LLDPE, GPPS, and PVC). FAL (2018), the singular source
for data on recycled plastic resins, includes only HDPE, PET, and PP resins.
• Update the retail transportation distance and fuel-type information with the more recently available
US Census Commodity Flow Survey (from 2017).

WARM Data Quality Assessment 19
3.2 Metals
Summary of Key Findings
Data Sources. The types of metals modeled in WARM include aluminum cans, aluminum ingot, steel
cans, and copper wire. This WARM material category focuses on container and packaging end-uses for
aluminum and steel and electrical end-uses for copper wire. Metals can be employed in various sectors
and products; other major uses of aluminum in addition to those considered in WARM include
construction, consumer durables, electrical, machinery and equipment, transportation, and other
industrial uses. For steel, other major uses include service centers and distributors, construction (which
is modeled in WARM but discussed in the construction materials section below), transportation, and
other industrial uses. Other major uses of copper include building construction, industrial machinery and
equipment, transportation equipment, and consumer and general products. A mixed metals material
type is also modeled in WARM, reflecting the weighted average using the latest relative recovery rates
for steel and aluminum cans. See column I of Table 8 below for these recovery rates. See the “Mixed
Metals” material in Table 9 below for data quality scoring that follows this weighting scheme.
Table 8. Relative Prevalence of Metals in the Waste Stream in 2015
(a)
(I(c)
(d)
(e)
(f)
Material
Generation
(Short Tons)
% of Total
Container
Metal
Generation
Recovery
(Short Tons)
% of Total
Metals
Recovery
Recovery Rate
Aluminum Cans
1,350,000
43%
670,000
35%
50%
Aluminum Ingot
NA
NA
NA
NA
NA
Steel Cans
1,740,000
57%
1,240,000
65%
71%
Copper Wire
NA
NA
NA
NA
NA
Source: EPA (2018).
NA = Not available.
The WARM emission and energy factors for these metals rely on 9 primary data sources. For the
development of the aluminum can and aluminum ingot factors, the primary data sources include:
• The LCA report, Life Cycle Impact Assessment of Aluminum Beverage Cans (PE Americas 2010),
which provides process and process non-energy data for aluminum beverage cans.
6
It is used to
develop the process and process non-energy emission factors for aluminum cans and aluminum
ingot and to understand the current mix of inputs (recycled vs. virgin) for WARM. This source
was further disaggregated by process energy, transportation energy, and non-energy process
emissions for WARM by the Aluminum Association in a spreadsheet provided to ICF and EPA (PE
Americas 2011). (KEY)
6
The Aluminum Association provided a detailed spreadsheet of their calculations (titled "Data for ICF-EPA_ICF
formatted 08-04-11”) to supplement the information published in the PE Americas report. ICF had several
conversations with Senior Sustainability Specialist, Jinlong Marshall Wang to clarify the details in the calculations’
spreadsheet. Because this spreadsheet is considered an extension of the PE Americas report, the calculation
spreadsheet was not assessed for data quality separately from the PE Americas report (2010).

WARM Data Quality Assessment 20
• An unpublished database with transportation energy data developed jointly by the Research
Triangle Institute and EPA (RTI 2004). It documents energy consumption associated with virgin
and recycled production process transportation across material types and is used to develop the
transportation energy emissions factor for aluminum.
The primary data sources used to develop the steel can factors include:
• The EPA report, Background Document A: A Life Cycle of Process and Transportation Energy for
Eight Different Materials, Greenhouse Gas Emissions from Management of Selected Materials in
Municipal Solid Waste, prepared by Franklin Associates, Ltd. (EPA 1998a). This report provides
process energy, process non-energy and transportation energy data for steel cans. (KEY)
• Personal communication between ICF and Franklin Associates, Ltd. that culminated in a
documented review of recycled content values and current mix of steel can production
(identifying the percentage that is from recycled versus virgin inputs) (FAL 2003a). The
communications information was based on two key resources: Ohio Department of Natural
Resources “Full Circle: Buying Recycled-Content Products” fact sheet,
7
and “Municipal Solid
Waste in the United States: 2000 Facts and Figures” document
8
developed by the EPA.
• Loss rate data provided by Franklin Associates, Ltd. (FAL 2003b).
The primary data sources used to develop the copper wire factors include:
• The report, Energy and Greenhouse Gas Factors for Personal Computers, prepared by Franklin
Associates, Ltd. (FAL 2002). It presents life-cycle energy and GHG emissions for personal
computers, including the GHG emissions associated with relevant copper production for use in
computers. It provides the process energy, process non-energy, and transportation energy data
used for the copper wire emission factors. (KEY)
• The report, Flows of Selected Materials Associated with World Copper Smelting, prepared by the
U.S. Geological Survey (USGS 2004) that provides information on the percent of current
production from recycled vs. virgin inputs for copper wire, and the copper wire scrap mix used
to create copper ingot.
For all metals, transportation-related information was obtained from the following data sources:
• The EPA report, Greenhouse Gas Emissions from the Management of Selected Materials (1998b),
which provides retail transportation
9
energy data used for the aluminum and steel calculations.
This is the predecessor to the WARM documentation and bases its retail transportation energy
on data received from Franklin Associates (FAL 1998) and the Tellus Institute (Tellus 1998) in
7
Ohio Department of Natural Resources. Full Circle: Buying Recycled-Content Products.
www.dnr.state.oh/us/recycling/awareness/facts/buy.htm.
8
Municipal Solid Waste in the United States: 2000 Facts and Figures. EPA530-R-02-001. Also, Franklin Associates, A
Division of ERG, working papers for this report and previous versions.
9
“Retail transportation” consists of the average truck, rail, water and other-modes transportation emissions
required to get the material from the manufacturing facility to the retail/distribution point.

WARM Data Quality Assessment 21
Background Documents A and B, respectively. The Franklin Associates Background Document A
provides the aggregated process and transportation energy for eight materials, including
aluminum and steel cans. The Tellus Institute Background Document B estimates the amounts
and types of energy consumed in raw materials acquisition and manufacturing of eight
materials, including aluminum and steel cans.
• US Census Commodity Flow Survey Preliminary Tables, Table 1: Shipment Characteristics by
Mode of Transportation for the United States (BTS 2013). This source is a CFS on domestic
freight shipments developed jointly by the BTS, the U.S. Census Bureau, and U.S. Department of
Commerce. It provides data on retail transportation distance and fuel-type.
Scoring. This DQA showed that data quality is generally consistent across all metals with an average and
weighted individual value of medium. Only the flow reliability and process review and completeness
indicators and average value for steel cans are rated differently, with a medium-low values. While the
DQA values varied across individual data sources, overall, all metals materials received an average value
that corresponds with the medium data quality level. On average, the metal sources scored the best in
the geographical correlation indicator category. For that indicator, the sources had medium-high data
quality, conveying that the region of data correlates well to that of WARM (i.e., the United States). A
summary of the results by DQI is shown in Table 9. The key findings for each of the sources used for the
different metal materials are discussed below.
Table 9: Summary of Data Quality Results for Metal Data Sources
Material
DQ Values by Indicator Grouping
Flow Reliability
Flow
Represent-
ativeness
Process Review
and
Completeness
Average
Weighted
Average
Aluminum Cans &
Aluminum Ingot
Medium
Medium
Medium
Medium
Medium
Steel Cans
Medium-low
Medium
Medium-low
Medium-low
Medium
Copper Wire
Medium
Medium
Medium
Medium
Medium
Mixed Metals
Medium
Medium
Medium
Medium
Medium
Metals
Medium
Medium
Medium
Medium
Medium
Note: For details on the indicator subcategories for each indicator grouping, see Section 2: Approach.
Aluminum Cans and Aluminum Ingot
The PE Americas (2010)
10
report along with the PE Americas (2011) spreadsheet had the highest data
quality among the metal data sources reviewed, showing a medium-high data quality. This result is due
to its strong geographical and technological correlation, flow reliability, process completeness, and
process review. The PE Americas (2010) report also developed its own rating using the same general
10
To develop the life-cycle process emission factors for aluminum, the PE Americas report uses WRI fuel emission
factors, global average grid emission factors (for bauxite mining and alumina refining); North America aluminum
industry mix and global aluminum industry mix (for smelting and casting) values; and the United States average
grid emission factors (for secondary production, can sheet rolling, and can making). These distinct calculation
inputs for the PE Americas report emission factors were sent to ICF in the “Data for ICF-EPA_ICF formatted 08-04-
11” spreadsheet. Because these are inputs to the PE Americas report, the rating for the PE Americas report is
reflective of these input sources as well.

WARM Data Quality Assessment 22
scoring metric as this report (see Appendix: Data Quality Assessment Matrix). There were additional
conversations with Marshall Wang of the Aluminum Association that also informed the development of
the process and process non-energy emission factors, but this information was included in the
supplemental spreadsheet provided to ICF and EPA (PE Americas 2011), which was assessed collectively
for the purposes of the DQA.
The RTI (2004) database that is used to develop the transportation energy emissions factor for
aluminum received a low data quality value. This is due to the age of the data, reducing the temporal
correlation, and limited to no documentation on the other data quality indicators. Details on the
development of and methodology for this database also could not be located, leading to the low data
quality value.
The scoring for EPA (1998b) was based on an average of the data quality values for both the Franklin
Associates and the Tellus Institute Background Documents (see Table 10 below). It received an average
value of medium-high due to its high quality process completeness and geographical and technological
correlation. Its data quality was lowest for temporal correlation and sample size because much of the
data were uncited, and the source is over 20 years old.
Table 10: EPA 1998b Background Document Ratings
Source
Flow Reliability
Flow
Representativeness
Process Review and
Completeness
FAL (1998) Background Document A
Medium-High
Medium
Medium-High
Tellus (1998) Background Document B
Medium-High
Medium
High
EPA 1998b (average of background
documents)
Medium-high
Medium
High
The Commodity Flow Survey (BTS 2013) has medium data quality overall. Its lowest data quality value is
for process completeness, and averages as medium for its flow representativeness. EPA (2018a) has an
average value of medium-low due to its high data quality across most categories, except for process
review.
Steel Cans
The EPA report, Background Document A: A Life Cycle of Process and Transportation Energy for Eight
Different Materials report (EPA 1998a), had high data quality for geographical correlation, technological
correlation, and process completeness because its data were representative of the United States, its
technology categories were equivalent, and it covered greater than 80 percent of the determined
process flows. EPA (1998a) received low data quality values for temporal correlation, as the source is
greater than 15 years old, and data generation and collection methods, as explanations were not found.
While there were third party reviews of the EPA (1998a) document, documented reviews of the Franklin
Associates data were not found, which impacted its process review data quality value.
The FAL (2003a) source, providing information on the current mix of steel can production received an
average value of medium-low, with low data quality for temporal correlation. This is because it is based
on data that are more than 15 years old, and low data quality for representativeness and process review

WARM Data Quality Assessment 23
and completeness as the sample size of the data is unknown, and there are no documented reviews of
the data. Because the information in FAL (2003a) is based on two key resources: Ohio Department of
Natural Resources “Full Circle: Buying Recycled-Content Products” fact sheet, and EPA’s “Municipal Solid
Waste in the United States: 2000 Facts and Figures” document, the scoring for FAL (2003a) was the
average of the scoring given to those sources. The Ohio Department of Natural Resources fact sheet was
not located, and thus was given a scoring of low data quality for each DQI category.
The FAL (2003b) source, providing the material loss rate information for steel cans, was not located, and
therefore was given low data quality scoring across all categories. The scoring for EPA (1998b), BTS
(2013), and EPA (2018a) are discussed in the aluminum can and ingot section above.
Copper Wire
FAL (2002) reflected a medium data quality value on average based on its mix of DQI values from low to
high quality. It had low data quality for temporal correlation, as much of the data are more than 15
years old, and for process completeness and data collection methods due to those aspects being
unknown and unable to assess. This source had medium-low data quality for flow reliability because it is
an old source with data based on documented estimates rather than verified measurements of
calculations. However, FAL (2002) had high data quality for geographical correlation, as the data are
U.S.-based, and medium-high quality for technological correlation and process review. Because
technology processes are slower to change, older data are not necessarily unrepresentative of the
current production and processing landscape. However, the data quality scoring matrix takes a cautious
approach by giving lower quality values to older data sources, in case the material type has a quicker
technological progress timescale.
The USGS (2004) source had an average data quality level of medium. Its lowest data quality is for
process completeness, and its highest data quality is for flow reliability, geographical correlation, and
technological correlation.
11
The scoring for EPA (1998b) and BTS (2013) are discussed in the aluminum
can and ingot section above.
Overall, the metals datasets scored as follows:
• Average indicator: Medium
• Average weighted indicator: Medium
Recommendations
Areas for improvement include:
• Identify and incorporate data on energy consumption from a more recent and publicly published
study. WARM currently pulls from the RTI (2004) database, which is over 15 years old and has the
lowest data quality of all the sources. As the dataset is unpublished, there is very little information
on its methodology which contributes to its low data quality.
11
See the USGS methodology report for more information on the rating: https://d9-wret.s3.us-west-
2.amazonaws.com/assets/palladium/production/s3fs-public/atoms/files/myb1-2004-surve-2.pdf

WARM Data Quality Assessment 24
• Identify and incorporate more recent data, particularly for steel and copper wire, to replace sources
such as EPA (1998a) and FAL (2002). Compared to other material categories, metal sources had the
lowest data quality in the temporal correlation category, with an overall medium-low level,
conveying that the data sources are on average greater than 15 years old. Because many
technologies are slower to change, older data may still be relevant for many processes. However,
there is still a clear need to update the data sources used in WARM for the metals section to studies
based on more recent datasets.
• Update the retail transportation distance and fuel-type information with the more recently available
US Census Commodity Flow Survey (from 2017).
• Assess the feasibility of updating the aluminum factors with data from a more recent assessment.
12
• Retain documentation for all data sources, including conversations with subject matter experts. Ask
subject matter experts that inform WARM to share published sources for any specific data elements.
3.3 Glass
Summary of Key Findings
Data Sources. The glass emission and energy factor calculations rely on two key data sources for process
energy and process non-energy emission factors and four key data sources for the transportation
emission factor calculations.
The primary data sources used for glass process energy and process non-energy data include:
• A database with process energy and process non-energy data developed jointly by the Research
Triangle Institute and EPA (RTI 2004). Process energy and process non-energy data are sourced
from this unpublished database that documents energy consumption associated with virgin and
recycled production processes across material types. (KEY)
• A U.S. Department of Energy (DOE) report, Energy and Environmental Profile of the U.S. Glass
Industry. DOE (2002), which provides assumptions on the average composition of glass and fuel
used to combust glass. This source provides an energy and environmental profile of the U.S.
glass industry.
• In-house data from Franklin Associates (FAL 2003b) provides information on the current mix of
production from virgin and recycled inputs for glass manufacturing, typical glass recycled
content values in the marketplace, and glass loss rates.
The primary data sources used for the transportation emission calculations include:
12
Wang 2022. "The Environmental Footprint of Semi-Fabricated Aluminum Products in North America." The
Aluminum Association. January 2022. https://www.aluminum.org/sites/default/files/2022-01/2022_Semi-
Fab_LCA_Report.pdf (Accessed: January 17, 2023).
WARM Data Quality Assessment 25
• The Role of Recycling in Integrated Solid Waste Management to the Year 2000 (FAL 1994). This
report is a study on the role of recycling in integrated solid waste management published by
Franklin Associates. This report provides GHG emissions from transportation energy usage for
transportation of waste to the combustion facility.
• US Census Commodity Flow Survey Preliminary Tables, Table 1: Shipment Characteristics by
Mode of Transportation for the United States (BTS 2013). This source is a Commodity Flow
Survey (CFS) on domestic freight shipments developed jointly by the Bureau of Transportation
Services (BTS), the U.S. Census Bureau, and U.S. Department of Commerce. It provides
additional assumptions on retail transportation energy usage (average shipping distances and
modes) for glass.
• Typical transportation fuel efficiencies are sourced from the EPA report, Greenhouse Gas
Emissions from the Management of Selected Materials, prepared by ICF for EPA, (EPA 1998b),
which is the original WARM emission factor methodology document.
Scoring. On average, the data quality for the glass data sources is highest within the geographical and
technological correlation indicators. On average, the sources reflect medium data quality, conveying
that the region of data correlates relatively well to that of WARM (the United States) and the majority of
technology categories are equivalent.
13
The low data quality of the key source for the glass analysis
brought down the weighted average value to medium-low. A summary of the results by data quality
indicator groupings is shown in Table 11. The key findings for each of these sources are discussed below.
Table 11: Summary of Data Quality Results for Glass Data Sources
Material
DQ Values by Indicator Grouping
Flow
Reliability
Flow
Representative
-ness
Process
Review and
Completeness
Average
Weighted
Average
Glass
Medium
Medium
Medium
Medium
Medium-low
Note: For details on the indicator subcategories for each indicator grouping, see Section 2: Approach.
RTI (2004) was considered to be a low quality source as it is an unpublished database developed by the
Research Triangle Institute and EPA; and details on the development of and methodology for that
database have not been found. This is especially salient as the process energy and non-process energy
emission factors for glass is almost entirely based on RTI (2004), with additional glass composition
assumptions sourced from DOE (2002). The highest data quality was with FAL (1994), which includes a
fairly robust dataset; however, the data collection occurred in 1992.
FAL (2003a) is based on in-house data provided by Franklin Associates to ICF. This source was not found
as it is based on in-house data from Franklin Associates, and therefore was considered to reflect low
data quality across all categories.
13
Technology categories are process design, operating conditions, material quality, and process scale.

WARM Data Quality Assessment 26
For the development of the weighted average glass data quality value, the RTI (2004) data source is
weighted more heavily than the rest of the sources as it is the main source of process energy and
process non-energy data used for the development of WARM glass emission and energy factors.
Overall, the glass datasets scored as follows:
• Average indicator: Medium
• Average weighted indicator: Medium-low
The difference between the medium quality average indicator value and the medium-low quality
average weighted indicator value shows the impact of a key data source being low quality. RTI (2004)
was determined to be a low quality, out of date source with a poorly documented methodology.
However, WARM relies on RTI (2004) as a key source to inform glass emissions, which brings down the
overall quality of the glass section, particularly when considering an average that weighs RTI (2004)
more heavily than other sources.
Recommendations
Areas for improvement include:
• Conduct research to identify a more recent peer-reviewed study for the glass process energy
emission factors than the current data source, RTI (2004). On average, the data quality for the glass
data sources is lowest within the temporal correlation category.
• Identify more recent and publicly available information on the current mix of production for glass.
• Update the retail transportation distance and fuel-type information with the more recently available
US Census Commodity Flow Survey (from 2017).
• Consider a more updated source for transportation fuel efficiencies (such as fuel efficiencies
published by NREL
14
).
3.4 Paper
Summary of Key Findings
Data Sources. Paper materials and products included in WARM are magazines, newspaper, office paper,
phonebooks, textbooks, and corrugated containers such as cardboard packing boxes. The paper material
emission factor and energy factor calculations rely on seven data sources. Of these, three key data
sources informed process energy, process non-energy, and transportation emission factors, and
therefore were weighted more heavily when determining overall data quality of paper sources. These
include:
• An unpublished database developed jointly by the Research Triangle Institute and the U.S.
Environmental Protection Agency Office of Research and Development (RTI 2004), which
provides information on the industrial process emissions and energy mix of paper materials
including corrugated containers, magazines, newspaper, office paper, phonebooks, and
textbooks. (KEY)
14
Alternative Fuels Data Center: Maps and Data - Average Fuel Economy by Major Vehicle Category (energy.gov)

WARM Data Quality Assessment 27
• The EPA Report, Greenhouse Gas Emissions from Management of Selected Materials in
Municipal Solid Waste, Background Document A: A Life Cycle of Process and Transportation
Energy for Eight Different Materials, prepared by Franklin Associates, Ltd. (EPA 1998a), which
provides information on energy requirements for production of recycled corrugated containers.
(KEY)
• Greenhouse Gas Emissions from Management of Selected Materials in Municipal Solid Waste,
Background Document A, Attachment 1: A Partial Life Cycle Inventory of Process and
Transportation Energy for Boxboard and Paper Towels, published by Franklin Associates, Ltd.
(FAL 1998), which provides information on the composition of mixed paper and energy
requirements for production of virgin and recycled boxboard. (KEY)
The paper factors also relied on other non-key data sources:
• Personal communication between ICF and Franklin Associates, Ltd. that culminated in a
documented review of recycled content values and current mix of paper material production
(identifying the percentage that is from recycled versus virgin inputs) (FAL 2003a).
• In-house data from Franklin Associates (FAL 2003b) provides information on retention rates
during recycling of paper materials.
• U.S. Census Commodity Flow Survey Preliminary Tables, published by the U.S. Bureau of
Transportation Statistics (BTS) Research and Innovative Technology Administration (BTS 2013),
which provides data on transportation energy.
• Inventory of U.S. Greenhouse Gas Emissions and Sinks: 1990 – 2013, a report published by the
U.S. EPA (EPA 2015), which provides measurements on fuel-specific carbon content and
coefficients.
Scoring. A summary of the results by data quality indicator groupings is shown in Table 12. The key
findings for each of these sources are discussed below.
Table 12: Summary of Data Quality Results for Paper Data Sources
Material
DQ Values by Indicator Grouping
Flow
Reliability
Flow
Represent-
ativeness
Process
Review and
Completeness
Average
Weighted
Average
Paper
Medium-low
Medium
Medium-low
Medium-Low
Medium
Note: For details on the indicator subcategories for each indicator grouping, see Section 2: Approach.
Key sources for paper, RTI (2004), EPA (1998a), and FAL (1998), provide process energy, process non-
energy, and transportation energy requirements for the manufacturing of various paper materials.
Overall, the paper flow representativeness indicator reflected medium data quality, while the flow
reliability and process review and completeness indicators reflected medium-low data quality. On
average, the paper data sources were of low quality for temporal correlation; medium-low for flow
reliability, data collection methods, and process review; and medium quality for geographical
correlation, technological correlation, and process completeness. Poor temporal correlation was due to
WARM Data Quality Assessment 28
the publication years of the paper data sources, which range from 1998 to 2015. Data collection
methods saw more variable data quality, but two sources, including key source RTI (2004) and EPA
(1998a), were deemed low quality for this category as the sources did not list sites or time periods
sampled. This left representativeness unknown and indicated a poor data source. Concerning
geographical correlation, the data sources for paper were created using data from the United States,
which is the same region of data that WARM represents. On average, indicators were determined to be
of medium-low quality, and of medium quality for the weighted average giving additional weight to the
key data sources.
RTI (2004) had the lowest data quality among the key paper sources. As noted previously, RTI (2004) is
an unpublished database developed by the Research Triangle Institute and EPA. Details on the
methodology of this database are not available, resulting in an overall low-quality level. EPA (1998a) had
high data quality for geographical correlation, technological correlation, and process completeness
because its data were representative of the United States, its technology categories were equivalent,
and it covered greater than 80 percent of the determined process flows. EPA (1998a) received low data
quality values for temporal correlation, as the source is greater than 15 years old, and data generation
and collection methods, as explanations were not found. While there were third party reviews of the
EPA (1998a) document, documented reviews of the Franklin Associates data were not found, which
impacted its process review data quality value. FAL (1998) had medium-high to high data quality for five
of the seven indicators. Temporal correlation, due to age of data, was the lowest mark for this source.
One of the other sources, EPA (2015), which provides corrugated containers’ fuel-specific carbon
content, was a high data quality source, as it is a more recent report published by the EPA and verified
by multiple third parties. This report also has Annexes that detail methodology, scale, scope, and
sources that reflect a higher quality source.
Overall, the paper datasets scored as follows:
• Average indicator: Medium-low
• Average weighted indicator: Medium
Recommendations
Areas for improvement include:
• Update all paper data sources to more recent sources where applicable, based on the quality of the
temporal correlation (low data quality). Some sources may not have more recent versions, but
updated data should be used if possible. This dataset is most in need of updating.
• Update all paper data sources from those that use data generated from estimates to data generated
from verified or non-verified measurements or calculations, which would improve the data sources’
flow reliability, and therefore the reliability of WARM.
• Identify more recent and reliable source(s) to update the RTI (2004) data set providing
manufacturing and transportation energy use data for all paper types (corrugated containers,
magazines/third-class mail, newspaper, office paper, phonebooks, and textbooks).

WARM Data Quality Assessment 29
3.5 Electronics
Summary of Key Findings
Data Sources. Electronics covered in WARM include desktop CPUs, portable electronic devices (tablets,
laptops, and smartphones), flat-panel displays (TVs and monitors), CRT displays, electronic peripherals
(mice and keyboards), and hard-copy devices (i.e., printers), and a mixed electronics category, which is a
combination of the other electronic categories weighted by their prevalence in the U.S. waste stream.
The electronics material emission factors and energy factor calculations rely on 16 data sources for
information regarding process emissions of electronic components, the component mass share within
WARM’s electronic categories, recovery and recycling practices for the different electronics, and the
prevalence of electronic types in the U.S. waste stream.
Four data sources played a key role in developing the final WARM electronic emission and energy
factors:
• Argonne National Laboratory’s Greenhouse Gases, Regulated Emissions, and Energy Use in
Transportation (GREET) 2 Model (ANL 2018), which is used to source process emissions for many
of the electronic materials’ components, including plastics and some metals. (KEY)
• Ecoinvent Centre’s life cycle dataset v3.2 (Ecoinvent Centre 2015), which was used to source
process emissions for additional components and metal types, including gold, silver, and silica
sand. (KEY)
• The report, Sustainable Materials Management for the Evolving Consumer Technology
Ecosystem (Babbitt et al. 2017), which calculates the component mass share in the electronic
types in WARM. These percentages combined with the process emissions of the component
types formed the basis for the component share of various metals, plastics, and other rare
metals found in each of WARM’s electronic categories. (KEY)
• Journal article, Comparing embodied greenhouse gas emissions of modern computing and
electronics products (Teehan and Kandlikar 2013), which includes virgin production energy data
for printed circuit boards, flat panel display modules, and batteries. (KEY)
Process emissions for the various components come largely from the ANL 2018’s GREET model,
Ecoinvent v3.2, and Teehan and Kandlikar 2013.
15
Multiplying component mass shares from Babbitt et
al. (2017) by these process emissions yielded a majority of the overall emissions for electronic types in
WARM.
15
Teehan and Kandlikar 2013 data verification methodology involved the hand disassembly of printed circuit
boards, flat panel display modules, and batteries to verify the mass share of different components. These masses
were then entered into the Ecoinvent Database to gather emission results, albeit an earlier version than the one
cited by WARM (v2.2 versus v3.2).
WARM Data Quality Assessment 30
Additional sources are used to help fill in the gaps of information regarding specific emission factors for
electronic types and component mass share in WARM, background information in the supporting
documentation, and ancillary data needed to form accurate assumptions in WARM. These include:
• End-of-life management practices and emissions from recycling are sourced mainly from Bigum
et al. (2012) and Vanegas et al. (2017). Additional information is sourced from Dewulf et al.
(2010) for information on battery recycling and Turner et al. (2015) on CRT recycling practices.
• The Electronics Recycling Landscape report (Mars et al. 2016), which provides information on
the shares of electronic types in the U.S. waste stream used in the mixed electronics category in
WARM.
• The assumption for share of electronic types in the U.S. waste stream used in the mixed
electronics material type is sourced from Mars et al. (2016).
• A report on cellphone materials and life cycle emissions of its components (Andrea and Vaija
2014).
• Four reports conducted by Franklin Associates, studying the life cycle emissions of plastic (FAL
2011a, FAL 2011b, FAL 2018) and copper (FAL 2002), including the production phase and
recycling.
• Journal article, Improving Resource Efficiency through Recycling Modelling: A Case Study for LCD
TVs report (Vanegas et al. 2015) that studies process emission information on LCD TVs.
• The report, Life Cycle Assessment of a Personal Computer (Hikwama 2005), that studies the mass
share in a personal computer.
Recycling and end-of-life information was sourced from the following sources:
• Journal article, Metal recovery from high-grade WEEE: A life cycle assessment (Bigum et al.
2012), which reviews recycling emissions for electronic types, namely rare metals in circuit
boards.
• A report on the process and associated emissions from recycling lithium cobalt oxide batteries
(Dewulf et al. 2010).
• EPA’s 2008 report Electronics Waste Management in the United States: Approach I, which
provided additional information on electronic disposal practices, used mainly in the supporting
documentation chapter.
• A report on CRT material recovery and recycling practices (Turner et al. 2015).
Scoring. Data quality for electronics data sources ranged from medium to high. The variation among
sources is due largely to differences in data collection methods (measurements versus documented
calculations), review process of the studies, and the age of the sources. A summary of the electronics
results by data quality indicator groupings is shown in Table 13. The key findings for each of these

WARM Data Quality Assessment 31
sources are discussed below. Unlike other material categories in WARM, most sources cited in the
electronics category are used by many or all material types. This is primarily because these sources
studied the emission factors from component materials (e.g., copper, plastic, aluminum) found in most
or all of the electronic materials. Final emission values for electronic materials were then calculated
using the proportion of the component materials used in each material. For this reason, the sources
were grouped together under a single “Electronics” category.
Table 13: Summary of Data Quality Results for Electronic Sources
Material
DQ Values by Indicator Grouping
Flow
Reliability
Flow
Represent-
ativeness
Process
Review and
Completeness
Average
Weighted
Average
Electronics
Medium-high
Medium-high
Medium-high
Medium-high
Medium-high
Note: For details on the indicator subcategories for each indicator grouping, see Section 2: Approach.
Overall, flow reliability and process completeness reflect the highest data quality of the indicators across
the data sources, as the sources covered all aspects of the life-cycle flow and generated data in a precise
and repeatable manner.
Other key findings from the review include:
• The estimated mean year of publication across the electronics sources was 2013, which reflects a
temporal data quality level of medium.
• The largest amount of variance in an indicator category came from the data collection methods
indicator, which focuses on “the robustness of the sampling methods” used by the study. Those
studies that sourced data from products and surveys across numerous companies in the industry
were considered as high quality, while those that examined only a handful of products received data
quality levels of medium-low and low.
• Two of the most critical sources – ANL (2018), Babbitt et al. (2017) – had high data quality, and the
third most critical s–rce -- Ecoinvent Centre (2015) – had medium-high data quality. This was due in
large part to their high-quality data generation methods, diligent review process, and recency of
publishing.
• Rather than attempt to gather data by electronic type, the current approach used in WARM
examines studies that provide emission estimates on the components that make up these
electronics and then combines that with Babbitt et al. 2017’s findings on mass shares to calculate
overall life cycle emissions.
Overall, the electronics datasets scored as follows:
• Average indicator: Medium-high
• Average weighted indicator: Medium-high
Recommendations
Areas for improvement include:

WARM Data Quality Assessment 32
• Corroborate Babbitt et al. (2017) findings with another, recent source that similarly examines the
overall material share of different components in electronic types.
• Identify alternative higher quality data sources to potentially update the sources that received a
data quality value of medium or lower on their overall assessment, including Vanegas et al. (2017),
16
FAL (2002), Dewulf et al. (2010), Hikwama (2005), and Mars et al. (2016).
• Update process emissions from the latest versions of the GREET model (2018 versus 2022) and
Ecoinvent (v3.2 versus v3.9).
3.6 Construction Materials
Summary of Key Findings
Data Sources. Construction materials included in WARM include asphalt concrete, asphalt shingles,
carpet, clay bricks, concrete, dimensional lumber, drywall, fiberglass insulation, fly ash, medium-density
fiberboard, structural steel, vinyl flooring, and wood flooring. The data quality analysis for construction
materials relied on a total of 52 data sources. Of these, the majority of process energy, process non-
energy, and transportation emission factors data related to construction materials relies on 21 key data
sources, which were weighted more heavily when assessing data quality due to their importance in
WARM calculations:
• Asphalt Concrete
o Life-Cycle Assessment of Warm-Mix Asphalt: An Environmental and Economic
Perspective is a life cycle assessment presentation for Louisiana State University (Hasan
2009), which provides information on the composition of hot-mix asphalt. (KEY)
o Road Rehabilitation Energy Reduction Guide for Canadian Road Builders, a guide
published by the Canadian Industry Program for Energy Conservation (Canadian Industry
Program for Energy Conservation 2005), which provides data on the energy
consumption of manufacturing asphalt. (KEY)
• Asphalt Shingles
o Life Cycle Analysis of Residential Roofing Products (Athena Sustainable Materials
Institute 2000) is a life cycle report that provides information on the manufacturing of
virgin asphalt shingles. (KEY)
o Environmental Issues Associated with Asphalt Shingle Recycling, a report prepared for
Construction Materials Recycling Association (CMRA) and the U.S. EPA (CMRA 2007),
which provides data on the composition, recycling, and combustion of shingles. (KEY)
• Carpet
o Energy and Greenhouse Gas Factors for Personal Computers (FAL 2002) is a report that
provides data on certain material components that are used to make carpet. This source
sheds light on the fuel mix and energy use in the manufacturing of components used in
the production of carpet. (KEY)
o Background Document for Life-Cycle Greenhouse Gas Emission Factors for Carpet and
Personal Computers (EPA 2003a) is a report that provides data on the process emissions
and fuel mix in carpet production. (KEY)
16
Vanegas et al. 2017’s score suffers due to poor scores in the data collection methods, flow reliability,
geographical correlation, and temporal correlation indicators.
WARM Data Quality Assessment 33
• Clay Bricks
o Life Cycle Analysis of Brick and Mortar Products (Athena Sustainable Materials Institute
1998) is a life cycle report that provides data on the process and transportation
emissions of clay bricks. (KEY)
o Inventory of U.S. Greenhouse Gas Emissions and Sinks: 1990 – 2016 (EPA 2018b) is a
report that provides measurements and data on the life cycle emissions factors related
to manufacturing and transportation of clay bricks. (KEY)
• Concrete
o Background Document for Life-Cycle Greenhouse Gas Emission Factors for Clay Brick
Reuse and Concrete Recycling (EPA 2003b) is a report that documents the process and
transportation emissions of the life cycle of virgin concrete. (KEY)
• Dimensional Lumber
o Life-cycle energy and GHG emissions for new and recovered softwood framing lumber
and hardwood flooring considering end-of-life scenarios (Bergman et al. 2013) is a report
that provides cradle to gate greenhouse gas emissions data for new and recycled
dimensional lumber. (KEY)
• Drywall
o Life Cycle Analysis of Gypsum Board and Associated Finishing Products, published by
Athena Sustainable Materials Institute (Venta 1997), which provides data on the
manufacturing, fuel mix, and transportation emissions associated with the life cycle of
drywall. (KEY)
o Cradle-to-Gate Life Cycle Inventory of Nine Plastic Resins and Two Polyurethane
Precursors, prepared for the Plastics Division of the American Chemistry Council (FAL
2007), which provides data on the process emissions and fuel mix associated with
producing chemicals and materials used in the manufacturing of drywall. (KEY)
• Fiberglass Insulation
o Building for Environmental and Economic Sustainability (BEES) Technical Manual and
User Guide (Lippiatt 2007) is a guide to BEES, a software that helps users select
environmentally preferred, cost-effective building products. The user guide summarizes
data found in BEES, including the manufacturing and process emissions of fiberglass
insulation. (KEY)
• Fly Ash
o Background Document for Life-Cycle Greenhouse Gas Emission Factors for Fly Ash Used
as a Cement Replacement in Concrete (EPA 2003c) is a life cycle analysis that provides
data on the recycling emissions of fly ash. (KEY)
• Medium-Density Fiberboard
o Life-cycle inventory of medium density fiberboard in terms of resources, emissions,
energy and carbon, published in Wood and Fiber Science (Wilson 2010), which provides
information on the life cycle manufacturing and transportation emissions of medium-
density fiberboard. (KEY)
• Structural Steel
o Structural Section and Hot-Dip Galvanized Steel Production in China – Life cycle
assessment report (American Iron and Steel Institute [AISI] 2017) is an industry report
that provides information on the manufacturing and transportation life cycle emissions
associated with virgin inputs of structural steel. (KEY)

WARM Data Quality Assessment 34
o Fabricated Structural Steel – Environmental product declaration supporting background
report (AISI 2016) is an industry report describing the process emissions and
manufacturing inputs of recycled structural steel. (KEY)
• Vinyl Flooring
o Life Cycle Assessment of PVC and of principal competing materials, commissioned by the
European Commission (Baitz et al. 2004), which provides data on the life cycle of
polyvinyl chloride (PVC) and its use in the composition of vinyl flooring. (KEY)
• Wood Flooring
o Environmental Impact of Producing Hardwood Lumber Using Life-Cycle Inventory,
published in Wood and Fiber Science (Bergman and Bowe 2008), is a life cycle report
that provides information on the manufacturing material consumption of wood flooring.
(KEY)
o Life-Cycle Inventory of Solid Strip Hardwood Flooring in the Eastern United States, a
graduate student report published at the University of Wisconsin — Madison (Hubbard
and Bowe 2008), provides data on the manufacturing and transportation emissions
associated with the life cycle of wood flooring. (KEY)
o Life Cycle Analysis of Residential Roofing Products (Athena Sustainable Materials
Institute 2000) is a life cycle report that provides information on the manufacturing of
virgin wood products, which are also used in wood flooring.
17
(KEY)
Other data sources for specific construction materials include:
• Asphalt Concrete
o A Life Cycle Inventory for Road and Roofing Asphalt is a life cycle analysis report
prepared for Athena Sustainable Materials Institute (Athena Sustainable Materials
Institute 2001), which provides information on process emission factors of asphalt
concrete.
o 1997 Economic Census, Mining (U.S. Census Bureau 1997) is a government report on the
U.S. mining industry that provides data on material and fuel mix inputs for asphalt
concrete.
o A Life-Cycle Analysis of Alternatives for the Management of Waste Hot-Mix Asphalt,
Commercial Food Waste, and Construction and Demolition Waste is a master’s in civil
engineering thesis published in the North Carolina State University library (Levis 2008),
which provides information on recycling emissions of asphalt concrete.
o U.S. Life-Cycle Inventory Database, a comprehensive report published by the National
Renewable Energy Laboratory (NREL 2009), which provides information on the energy
use of producing limestone that is used to manufacture asphalt concrete.
• Asphalt Shingles
o Construction and Demolition Debris Recycling: Methods, Markets, and Policy is a
master’s thesis for the University of Central Florida (Cochran 2006), which provides data
on recycling emissions for asphalt shingles.
o Materials Recycling and Processing in the United States, Fifth Edition is a directory of
data (Berenyi 2007), which provides recycling loss rates of asphalt shingles.
17
Athena Sustainable Materials Institute (2000) is a key source for two Construction Materials, Wood Flooring and
Asphalt Shingles.
WARM Data Quality Assessment 35
• Carpet
o Eco-profiles of the Plastics Industry—Polyamide (Nylon 6) (Plastics Europe 2005a) is a
material profile that informs the process and transportation emissions of chemicals
used to produce carpet.
o Eco-profiles of the Plastics Industry—Polyamide (Nylon 66) (Plastics Europe 2005b) is a
material profile that informs the process and transportation emissions of chemicals
used to produce carpet.
• Concrete
o Aggregates from Natural and Recycled Sources–Economic Assessments for Construction
Applications (Wilburn and Goonan 1998) is a report that informs the process and
transportation emissions of recycled concrete.
• Dimensional Lumber
o Environmental Product Declaration (American Wood Council 2013) is a material report
that provides cradle to gate greenhouse gas emissions data for new dimensional
lumber.
• Drywall
o Composition of Municipal Solid Waste in the United States and Implications for Carbon
Sequestration and Methane Yield (Staley and Barlaz 2009) is a report that informs the
moisture content and carbon storage factor of drywall.
o Comprehensive life-cycle analysis of RAP: Comprehensive life-cycle analysis of
plasterboard (WRAP 2008) is a life cycle analysis report that informs the composition of
recycled drywall and energy requirements for drywall recycling.
o US Census Commodity Flow Survey Preliminary Tables, published by the U.S. Bureau of
Transportation Statistics (BTS) Research and Innovative Technology Administration (BTS
2013), which provides data on transportation energy.
o 2002 Commodity Flow Survey (U.S. Census Bureau 2004) is a report that measures the
transportation energy associated with recycled drywall.
• Fiberglass Insulation
o Life Cycle Analysis of Residential Roofing Products (Athena Sustainable Materials
Institute 2000) is a life cycle report that provides information on the manufacturing of
virgin fiberglass insulation, specifically that used in roofing.
o US Census Commodity Flow Survey Preliminary Tables, published by the U.S. Bureau of
Transportation Statistics (BTS) Research and Innovative Technology Administration (BTS
2013), which provides data on transportation energy.
o Glass Recycling–Life Cycle Carbon Dioxide Emissions, prepared for the British Glass
Manufacturers Confederation – Public Affairs Committee (Enviros Consulting 2003), is a
life cycle report that provides information on glass recycling and transportation
emissions.
o U.S. Life-Cycle Inventory Database, a comprehensive report published by the National
Renewable Energy Laboratory (NREL 2009), which provides information on the sourcing
of soda ash and limestone that are inputs in the manufacturing of fiberglass insulation.
• Medium-density Fiberboard
o Environmental Product Declaration (Composite Panel Association 2018) is a cradle-to-
gate life cycle report that provides information on the manufacturing emissions, virgin
inputs, and overall medium-density fiberboard production.

WARM Data Quality Assessment 36
• Structural Steel
o US Census Commodity Flow Survey Preliminary Tables, published by the U.S. Bureau of
Transportation Statistics (BTS) Research and Innovative Technology Administration (BTS
2013), which provides data on transportation energy.
o Greenhouse Gas Emissions from the Management of Selected Materials, published by
the U.S. EPA (EPA 1998b), which provides information on retail transportation energy
use. Global Steel Trade Monitor (U.S. Department of Commerce 2020) is a government
economic report that provides information on the virgin inputs that compose structural
steel.
o 2020 World Steel Figures (World Steel Association 2020) is an annual global industry
report that provides data on the virgin inputs that compose structural steel.
• Vinyl Flooring
o Resilient Flooring: A Comparison of Vinyl, Linoleum and Cork, published by the Georgia
Tech Research Institute (Jones 1999), which provides data on the manufacturing process
and emissions of vinyl flooring.
o Cradle-to-Gate Life Cycle Inventory of Nine Plastic Resins and Two Polyurethane
Precursors, prepared for the Plastics Division of the American Chemistry Council (FAL
2007), which provides data on the manufacturing emissions associated with producing
chemicals and materials used in the production of vinyl flooring.
o Eco-profile of high volume commodity phthalate esters (DEHP/DINP/DIDP), a report
prepared for The European Council for Plasticisers and Intermediates (ECPI) (ECOBILAN
2001), which provides data on the environmental impact of chemicals used in the
production of vinyl flooring, as well as information on transportation emissions.
o US Census Commodity Flow Survey Preliminary Tables, published by the U.S. Bureau of
Transportation Statistics (BTS) Research and Innovative Technology Administration (BTS
2013), which provides data on transportation energy.
• Wood Flooring
o Life-cycle energy and GHG emissions for new and recovered softwood framing lumber
and hardwood flooring considering end-of-life scenarios, published in Wood and Fiber
Science (Bergman et al. 2013), which provides data on the material consumption
associated with manufacturing wood flooring.
o Environmental Product Declaration (American Wood Council 2013) is a material report
that provides cradle to gate greenhouse gas emissions data on virgin manufacturing
inputs for wood flooring.
o US Census Commodity Flow Survey Preliminary Tables, published by the U.S. Bureau of
Transportation Statistics (BTS) Research and Innovative Technology Administration (BTS
2013), which provides data on transportation energy.
Two data sources could not be located and thereby were deemed low quality by default:
• Carpet
o Personal communication with Matthew Realff, Associate Professor of Chemical and
Biomolecular Engineering (Realff 2011), which provides information on material
composition and recycling of carpet.
• Fiberglass Insulation
o Email communication with Scott Miller, Knauf Insulation, and Beth Moore (Miller 2010),
which provides information on recycling emission of fiberglass insulation.
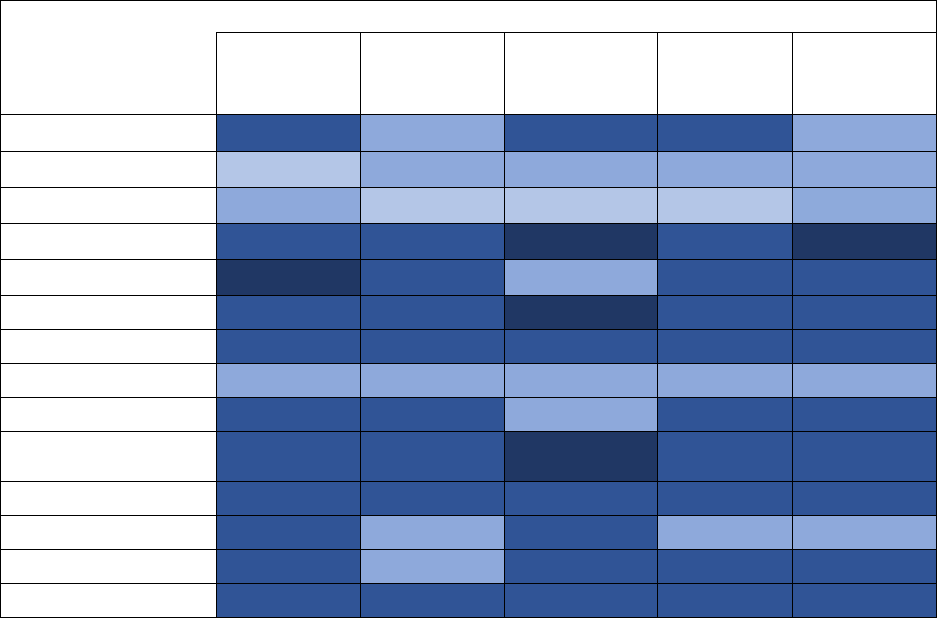
WARM Data Quality Assessment 37
Scoring. Data source analysis was conducted by material, and then averaged to show that, overall,
sources for construction materials were of medium-high data quality. A summary of the results by data
quality indicator groupings is shown in Table 14. The key findings for each of these sources used for the
different construction materials are discussed below and details on the individual sources’ scores can be
found in the Appendix.
Table 14: Summary of Data Quality Results for Construction Materials Sources
Material
DQ Values by Indicator Grouping
Flow
Reliability
Flow
Represent-
ativeness
Process
Review and
Completeness
Average
Weighted
Average
Asphalt Concrete
Medium-high
Medium
Medium-high
Medium-high
Medium
Asphalt Shingles
Medium-low
Medium
Medium
Medium
Medium
Carpet
Medium
Medium-low
Medium-low
Medium-low
Medium
Clay Bricks
Medium-high
Medium-high
High
Medium-high
High
Concrete
High
Medium-high
Medium
Medium-high
Medium-high
Dimensional Lumber
Medium-high
Medium-high
High
Medium-high
Medium-high
Drywall
Medium-high
Medium-high
Medium-high
Medium-high
Medium-high
Fiberglass Insulation
Medium
Medium
Medium
Medium
Medium
Fly Ash
Medium-high
Medium-high
Medium
Medium-high
Medium-high
Medium-density
Fiberboard
Medium-high
Medium-high
High
Medium-high
Medium-high
Structural Steel
Medium-high
Medium-high
Medium-high
Medium-high
Medium-high
Vinyl Flooring
Medium-high
Medium
Medium-high
Medium
Medium
Wood Flooring
Medium-high
Medium
Medium-high
Medium-high
Medium-high
Construction Materials
Medium-high
Medium-high
Medium-high
Medium-high
Medium-high
Note: For details on the indicator subcategories for each indicator grouping, see Section 2: Approach.
Asphalt Concrete
Asphalt concrete emissions factors and energy factors rely heavily on the data sourced from Hassan
(2009) and Canadian Industry Program for Energy Conservation (2005). They also use information from
the US Census Bureau (1997), Athena Sustainability Materials Institute (2001), Levis (2008), and NREL
(2009).
Hassan (2009) is a life cycle analysis of warm-mix asphalt, and provides information on emissions factors
and the composition of asphalt concrete. Despite being an older source with little information about the
sample size or reviewer process, Hassan (2009) was deemed to have, on average, medium quality data
as it was from the same area of study as WARM, and all technology categories were equivalent (e.g.,
process design, operating conditions, material quality, and process scale).
Of the asphalt concrete sources, US Census Bureau (1997), Levis (2008), and Athena Sustainability
Materials Institute (2001) were deemed to have the highest quality data, and received overall medium-
high data quality values. US Census Bureau (1997) provided data on material and fuel mix inputs, Levis
WARM Data Quality Assessment 38
(2008) informed recycling emissions, and Athena Sustainability Materials Institute (2001) included data
on process emissions factors. All other sources for asphalt concrete had a medium data quality value.
On average, asphalt concrete had medium-high quality sources for its process review and completeness
indicators. This indicates that the sources for this material tended to be reviewed by third parties to
verify data and covered a high percentage of process flows for this material.
The asphalt concrete datasets scored as follows:
• Average indicator: Medium-high
• Average weighted indicator: Medium
Asphalt Shingles
Asphalt shingles emissions factors and energy factors rely on two key sources: CMRA (2007) and Athena
Sustainable Materials Institute (2000). Other non-key sources include Cochran (2006) and Berenyi
(2007).
CRMA (2007) provides information on the emissions and energy factors of the composition, recycling,
and combustion of asphalt shingles. This source has a medium-low data quality, as it has low data
quality values for temporal correlation, process indicators, and data collection methods. However, the
source did have high geographical correlation as it is focused on the United States.
Athena Sustainable Materials Institute (2000) is the source for virgin production and manufacturing for
residential roofing materials, including asphalt shingles. This source was deemed medium-high quality,
as it reflected high data quality for technological correlation, data collection methods, and process
completeness data quality indicators, but reflected low-quality data for temporal correlation and
medium quality data for geographical correlation as it is a Canadian study conducted over 15 years ago.
The asphalt shingles datasets scored as follows:
• Average indicator: Medium
• Average weighted indicator: Medium
Carpet
Carpet emissions factors and energy factors rely on data from FAL (2002) and EPA (2003a). Other
sources also contribute: Plastics Europe (2005a) and Plastics Europe (2005b). Realff (2011) was not
located and was therefore deemed low quality.
FAL (2002) is a report on the fuel mix and energy use in the manufacturing of personal computers that
contains fuel and energy use information relevant to material components used to manufacture carpet.
The data quality of this source is medium based on its mix of DQI values from low to high quality. It had
low data quality for temporal correlation, as much of the data are more than 15 years old, and for
process completeness and data collection methods due to those aspects being unknown and unable to
assess. This source had medium-low data quality for flow reliability because it is an old source with data
based on documented estimates rather than verified measurements of calculations. However, FAL
WARM Data Quality Assessment 39
(2002) had high data quality for geographical correlation, as the data are U.S.-based, and medium-high
quality for technological correlation and process review.
EPA (2003a) is a report on the life cycle of carpet and personal computers that provided insight on fuel
mix and process emissions. The source had medium-high data quality. While this is an old source, it had
high ratings for geographical correlation, technological correlation, data collection methods, and process
completeness, as this is a U.S.-located report with verified data based on measurements that cover a
large percentage of flows, representative sample size, and a variety of technology types.
The carpet datasets scored as follows:
• Average indicator: Medium-low
• Average weighted indicator: Medium
Clay Bricks
WARM emissions factors and energy factors for clay bricks rely on two sources, both of which are key
sources: Athena Sustainable Materials Institute (1998) and EPA (2018b). Both provide key information
on the process and transportation emissions of clay bricks. Athena Sustainable Materials Institute (1998)
had medium-high data quality overall due to high and medium-high scores for flow and process
indicators as the data was based on calculations, used a representative sample size, had third party
reviewers, and a high percent of life cycle flows were covered. However, the source had low data quality
for temporal and geographical correlation for being an old life cycle analysis based in Canada. EPA
(2018b) is a high-quality source as it is more recent, based in the United States, and has other high
quality flow indicators and process indicators due to a large sample size representative of the clay bricks
industry, the use of third-party reviewers, and a large breadth of life cycle flows covered by the report.
The clay bricks datasets scored as follows:
• Average indicator: Medium-high
• Average weighted indicator: High
Concrete
Concrete emissions, energy, and transportation factors rely on two sources: EPA (2003b) and Wilburn
and Goonan (1998). EPA (2003b) is a medium-high quality key source that provides information into
process and transportation emissions for virgin concrete. This source had low quality for temporal
correlation, as it is over 15 years old, and medium-low quality for process review, as there was internal
review but not a documented third-party review of the study. All other process and flow indicators were
deemed high or medium-high quality as the sources covered over 80 percent of recycled and virgin
concrete life cycle flows and considered a representative sample size in the United States. Wilburn and
Goonan (1998) was also a medium-high quality source. This source provided information on process and
transportation emissions for recycled concrete, and had similar scores to EPA (2003), where its lowest
data quality indicators were temporal correlation and internal review, and all others were high to
medium quality.
WARM Data Quality Assessment 40
The concrete datasets scored as follows:
• Average indicator: Medium-high
• Average weighted indicator: Medium-high
Dimensional Lumber
Dimensional lumber relies on Bergman et al. (2013) and American Wood Council (2013). Both sources
provide data related to the life cycle emissions of dimensional lumber. Bergman et al. (2013) considers
the cradle to grave emissions of new and recycled dimensional lumber, while American Wood Council
(2013) is a report on the cradle-to-grave emissions of new dimensional lumber. Both sources had
medium-high quality flow reliability as they use verified data based on calculations and medium-low
quality temporal correlation as they are over 10 years old. They also had medium-high or high quality
data quality values for all other flow and process indicators, due to geographical correlation being based
in America or North America, a highly representative sample size for data collection, documented third
party reviewers, and a high percentage of flows covered.
The dimensional lumber datasets scored as follows:
• Average indicator: Medium-high
• Average weighted indicator: Medium-high
Drywall
Drywall relies on six sources to inform energy factors and emission factors: Venta (1997), FAL (2007),
WRAP (2008), BTS (2013), Staley and Barlaz (2009), and US Census Bureau (2004). Of these sources,
Venta (1997) and FAL (2007) play a greater role in informing the energy and emissions factors of drywall.
Venta (1997) provides data on manufacturing emissions and fuel input, as well as transportation
emissions for the life cycle of drywall. FAL (2007) gives insight into process emissions and energy use of
drywall from when it is produced to when it hits the market. Both were deemed medium-high quality, as
both sources had high data quality values for technological correlation, data collection methods, process
review, and process completeness. They used an equivalent variety of technology types, a
representative sample size, verified third party reviewers, and data from more than 80 percent of the
drywall market over an adequate period. While they have a similar data quality, Venta (1997) had lower
data quality than FAL (2007) as it is a much older source and is based in Canada instead of the United
States.
US Census Bureau (2004) is a commodity survey that informed transportation energy factor for recycled
drywall. For this source, which overall reflected medium-high data quality, each flow and process
indicator provided high quality data besides temporal correlation, which was low quality as the source is
over 15 years old. WRAP (2008) provides the composition of recycled drywall and energy requirements
for drywall recycling that informed process emissions. This source was a medium quality source as it was
an older summary of a study conducted in the United Kingdom. It had low quality for process review and
medium-low quality for temporal and geographic correlation, but medium to high quality for other
process and flow indicators. BTS (2013) was also medium quality, as it has a low-quality process
WARM Data Quality Assessment 41
completeness due to an unknown percentage of flows evaluated, and medium-low quality for temporal
correlation and process review. Staley and Barlaz (2009) is a report that compares 11 statewide waste
characterization studies to understand the overall composition of discarded waste in the United States
and how that impacts carbon sequestration. This source was deemed to be of medium-high data quality,
as it calculates data from a wide range of facilities in states across every region of the United States. The
report considers a variety of technology categories, includes operating conditions and material quality,
and covers the majority of process flows. Despite these high quality data indicators, the source reflected
medium-high quality due to low-quality temporal correlation, as the source is from 2009.
The drywall datasets scored as follows:
• Average indicator: Medium-high
• Average weighted indicator: Medium-high
Fiberglass Insulation
One source, Lippiatt (2007), plays a key role in understanding the life cycle energy factors and emission
factors of fiberglass insulation. Other sources include: Athena Sustainable Materials Institute (2000),
Enviros Consulting (2003), NREL (2009), Miller (2010), and BTS (2013). Athena Sustainable Materials
Institute (2000) and BTS (2013) are cross cutting sources, as the former is also used to inform the life
cycle factors of asphalt shingles, and the latter is also used to inform the life cycle of drywall. The Miller
(2010) data source was unable to be located to determine data quality, so it was deemed low quality.
Lippiatt (2007) provides information on the manufacturing process and related emissions for fiberglass
insulation. This source is a report based on a tool that measures the environmental performance and life
cycle emissions of various building materials, including fiberglass insulation. This was determined to be a
medium-high quality source, as it had high data quality ratings for most flow indicators and process
indicators. However, this source is over 15 years old and based on verified calculations rather than
verified measurements resulting in low quality temporal correlation and flow reliability, respectively.
Enviros Consulting (2003) covers glass recycling and transportation emissions for fiberglass insulation.
This medium quality source is a life cycle assessment conducted in the United Kingdom over 15 years
ago, lowering its geographic and temporal correlations. The source also had a medium-low quality
process review, as the review was conducted by an internal reviewer. The remaining indicators,
technological correlation, data collection methods, process review and completeness, and flow
reliability were deemed high or medium-high quality. This is due to the source explaining process design,
operation conditions, material quality, and process scale; employing multiple third party reviewers;
using verified data; and covering the relevant fiberglass insulation market.
The fiberglass insulation datasets scored as follows:
• Average indicator: Medium
• Average weighted indicator: Medium
WARM Data Quality Assessment 42
Fly Ash
The energy, emissions, and transportation factors of fly ash rely on one primary data source, EPA
(2003c). This document pertains to life cycle GHG emissions factors for fly ash, particularly as a cement
replacement in concrete, which is the use considered in WARM. EPA (2003c) is a medium-high quality
source. Temporally this was a low-quality source, and the process review was medium-low quality as the
document was only reviewed internally. Other indicators were high quality, including process
completeness, data collection methods, technological correlation, and geographical correlation. Flow
reliability was medium-high data quality, as data was based on verified calculations rather than verified
measurements.
The fly ash fiberboard datasets scored as follows:
• Average indicator: Medium-high
• Average weighted indicator: Medium-high
Medium-density Fiberboard
The medium-density fiberboard material emissions factors and energy factors utilize two sources:
Wilson (2010) and Composite Panel Association (2018). Wilson (2010) plays a key role in determining life
cycle emissions of medium-density fiberboard, and focused on manufacturing and transportation
emissions, resources, energy, and carbon. Composite Panel Association (2018) informs the emissions
factors of manufacturing medium-density fiberboard with virgin inputs.
Wilson (2010) was a medium-high quality source that had high quality indicators besides flow reliability,
which was medium-high quality based on the use of calculations, and temporal correlation, which was
medium-low quality as the source is over 10 years old. Composite Panel Association (2018) was a high-
quality source as all process indicators and two flow indicators were found to be high quality. Three flow
indicators, geographical correlation, temporal correlation, and flow reliability, were medium-high
quality, as this source is over 5 years old, set in North America, and based on verified calculations.
The medium-density fiberboard datasets scored as follows:
• Average indicator: Medium-high
• Average weighted indicator: Medium-high
Structural Steel
The assessment of material life cycle emissions for structural steel relies on six data sources: AISI (2016),
AISI (2017), BTS (2013), EPA (1998), U.S. Department of Commerce (2020), World Steel Association
(2020). Of these, AISI (2016) and AISI (2017) were key sources, and BTS (2013) and (EPA 2018) informed
the data on structural steel but were also used to inform data on several other material types.
AISI (2016) is an environmental product declaration of fabricated hot-rolled structural steel sections. The
source has an overall high quality flow representativeness. It has a high geographic correlation as it
focuses on the American steel industry, and a medium temporal correlation as it was published within
WARM Data Quality Assessment 43
the last 10 years, although the report states the data has a five-year period of validity, which has
expired. It also has high quality technological correlation and data collection methods, as the source
examines a wide scale of technology categories and uses representative data from a high percentage of
the market. The source had a medium-high quality flow reliability as it is an industry report based on
estimated calculations, and high-quality process indicator data due to third party reviews and a large
percent of process flows covered in the report, including data from all stages of the steel life cycle.
AISI (2017) is also a LCA report, focusing on structural section and hot-dip galvanized steel production in
China. It was determined to have medium-high data quality. This is a comprehensive report based on
verified measurements, giving it a high-quality flow reliability. The wide scope of flows and
manufacturing processes covered, as well as the third-party review, resulted in this source having high
quality process indicators. Finally, flow representativeness was also high quality, as technological
correlation and data collection methods were both verified based on a wide variety of data sources and
technology scopes related to the life cycle of steel. The lowest quality indicators for this source were
temporal correlation, which was medium quality as the source is more than six but less than 10 years
old, and geographic correlation, which was medium-low quality as the geographic focus is China.
The structural steel datasets scored as follows:
• Average indicator: Medium-high
• Average weighted indicator: Medium-high
Vinyl Flooring
The assessment of material life cycle emissions for vinyl flooring relies on six data sources: Ecobilan
(2001), Jones (1999), Lippiatt (2007), Baitz et al. (2004), FAL (2007), and BTS (2013). Of these, Lippiatt
(2007), FAL (2007), and BTS (2013) are cross cutting sources that are also used to determine the
emissions factors and energy factors of other material types, including drywall and fiberglass insulation.
Two sources, Lippiatt (2007) and Baitz et al. (2004) are key sources to determining the life cycle
emissions factors of vinyl flooring.
Baitz et al. (2004) is an LCA of materials that informs the composition and process emissions of vinyl
flooring. Baitz et al. (2004) is considered a medium-high quality data source, as process indicators and
data collection methods indicate high quality and flow reliability shows medium-high quality. As this is a
European study conducted over 15 years ago, the temporal and geographic correlations were low or
medium-low quality. The technological correlation of this study was deemed medium quality, as it
addressed only two relevant technology categories.
Jones (1999) is an assessment of various flooring materials and provided information on the
manufacturing process emissions for vinyl flooring. This was a medium-low quality source, one of the
lowest ratings of all the construction materials data sources. This poor quality was due to its unspecified
geographic region of study, publishing date of over 15 years ago, low quality data collection methods,
and unknown percentage of flows evaluated. Most of the flow and process indicators were low quality,
with others being at most medium quality.
WARM Data Quality Assessment 44
The vinyl flooring datasets scored as follows:
• Average indicator: Medium
• Average weighted indicator: Medium
Wood Flooring
Wood flooring materials emissions factor and energy factor calculation utilize six data sources to
understand life cycle emissions: Bergman et al. (2013), American Wood Council (2013), BTS (2013),
Bergman and Bowe (2008), Hubbard and Bowe (2008) and Athena Sustainable Materials Institute
(2000). Of these, several sources also are used to inform data on multiple materials in addition to wood
flooring: Bergman et al. (2013) and American Wood Council (2013) are sources for dimensional lumber;
BTS (2013) is a source for vinyl flooring, fiberglass insulation, and drywall; and Athena Sustainable
Materials Institute (2000) is also a source for asphalt shingles and fiberglass insulation. Three sources
were determined to provide key information into the life cycle emissions of wood flooring materials:
Bergman and Bowe (2008), Hubbard and Bowe (2008), and Athena Sustainable Materials Institute
(2000).
Bergman and Bowe (2008) was deemed a medium-high quality source that considers manufacturing
process emissions and material consumption of hardwood lumber, a primary material used for wood
flooring. The study analyzes the environmental impact of hardwood lumber production in the United
States by calculating data from industry estimates and information provided by 20 lumber mills. As there
are hundreds of mills in the United States, this small sample means data collection method was deemed
medium-low quality for this source. Also, the source is 15 years old, so it has low quality temporal
correlation. Otherwise, process and flow indicators were of high or medium-high quality, averaging out
into an overall medium-high quality source.
Hubbard and Bowe (2008) is a medium quality source with low quality temporal correlation as it is 15
years old and medium-low quality data collection methods due to a small sample size of the market.
Hubbard and Bowe (2008) is also a study into the life cycle inventory of hardwood wood flooring
materials, but it focuses specifically on the Eastern US, where the majority of lumber mills are located.
Besides the lower temporal and data collection ratings, all other flow and process indicators are of high
or medium-high quality.
The wood flooring datasets scored as follows:
• Average indicator: Medium-high
• Average weighted indicator: Medium-high
Datasets for the individual construction materials ranged from medium-low to high quality, as noted at
the end of each material sub-section. Overall, the construction material datasets scored as follows:
• Average indicator: Medium-high
• Average weighted indicator: Medium-high
WARM Data Quality Assessment 45
Recommendations
Areas for improvement include:
• Identify and update construction materials data sources to more recent sources, where applicable,
based on the quality of the temporal correlation (medium-low or low data quality). Some sources
may not have more recent versions, but updated data should be used if possible.
• Replace Jones (1999) from the sources for vinyl flooring materials with a more recent study that has
higher quality process indicators, data collection methods, and geographic correlation. This is the
lowest quality construction materials data source.
• Find additional data sources for fly ash materials to the one that is currently used to provide
multiple sources that inform life cycle calculations of fly ash materials.
3.7 Tires
Summary of Key Findings
Data Sources. The tires material emission factors and energy factor calculations rely on 18 data sources
for information regarding the different end uses of scrap tires, tire and scrap tire energy content,
proportions of materials in scrap tires, and the process energy requirements of different end use
techniques.
Key data sources for the tires material pathway in WARM include the following:
• Rubber Manufacturers Association (RMA) 2009 Scrap Tire Markets in the United Sta
te
s: 9th
Biennial Report, which reviews the different end-of-life pathways for scrap tires and provides
the share of all tires that go to each disposal pathway (RMA 2009a). (KEY)
• Atech Group’s A National Approach to Waste Tyres, which provides the process energy
requirements for new tires (Atech Group 2001). (KEY)
Supporting information on management pathways and their associated emissions as well as additional
process emission data came from the following:
• California Integrated Waste Management Board’s (CIWMB) Tires as a fuel supplement:
Feasibility study: Report to Legislature report provides information on the energy content in
tires used for calculations regarding tire combustion (CIWMB 1992).
• EIA’s 2009 report on the fuel consumption requirements for new tires (EIA 2009).
• Venta and Nisbet’s Life Cycle Analysis of Residential Roofing Products report, which provides
offset energy values for sand used in rubber for tires (Venta and Nisbet 2000). These offsets
were applied to end-of-life management pathway calculations.
• RMA’s 2010 Facts at a Glance: How a Tire is Made report, which provides tire manufacturing
energy requirements (RMA 2010a).
• Personal communication with RMA’s Michael Blumenthal regarding the industry average scrap
tire recovery rate in the US (RMA 2010b).
WARM Data Quality Assessment 46
• RMA’s 2009 Scrap Tire Markets: Facts and Figures – Scrap Tire Characteristics report (RMA
2009b), which provides the average weight of a scrap tire used in WARM calculations.
Additional sources were used to calculate end-of-life emissions from different management pathways
and provided additional context in the supporting documentation chapter, including:
• Corti and Lombardi’s 2004 report on the retention rate and energy required for a tire recycling
process known as pulverization (Corti and Lombardi 2004).
• EPA’s Greenhouse Gas Emissions from the Management of Selected Materials report, that
included assumptions for the composition, uses, and energy of scrap tires. Information in this
report is used for context in the supporting documentation chapter (EPA 1998).
• ICF’s 2006 Life-Cycle Greenhouse Gas Emission Factors for Scrap Tires report. Information in this
report is used for context in the supporting documentation chapter (ICF 2006).
• Nevada Automotive Test Center provided information on the retreading of tires and the
associated energy required (Nevada Automotive Test Center 2006). Information in this report is
used for context in the supporting documentation chapter.
• NIST’s MEP Environmental Program, Best Practices in Scrap Tires & Rubber Recycling provided
information on the composition of different fibers in tires to help calculate scrap tire’s weight
composition by material (NIST 1997).
• Praxair’s 2009 report on cryogenic grinding of scrap tires was used for contextual information in
the supporting documentation chapter (Praxair 2009).
• Pimentel et al.’s U.S. Energy Conservation and Efficiency: Benefits and Costs report provides
information on synthetic rubber manufacturing as well as transportation requirements
(Pimentel et al. 2002).
Finally, transportation emission factors were sourced from the following reports:
• FAL’s 1994 The Role of Recycling in Integrated Solid Waste Management to the Year 2000
included transportation energy requirements in WARM calculations (FAL 1994).
• NREL’s 2015 US Life Cycle Inventory Database provides retail transport requirements (NREL
2015).
• U.S. Census Commodity Flow Survey includes additional retail transport requirements for WARM
calculations (BTS 2013).
Of the sources used in the tires section, two played key roles in determining process energy
requirements and emission factors for various end of life scenarios: Rubber Manufactures Association
(RMA — now the U.S. Tire Manufacturing Association) 2009 report on scrap tires and Atech Group’s
2001 report. The RMA (2009a) source details what share of used tires go toward different end-of-life
scenarios (e.g., combustion, reclamation, various recycling techniques) and the Aetch Group (2001)

WARM Data Quality Assessment 47
source provides process energy requirements for new tires to aid in source reduction calculations. The
remaining sources are used to help fill in gaps in data or provide additional context on the waste
management of tires in the documentation chapter. This includes detailed energy use data for different
recycling strategies (Corti and Lombardi 2004) and combustion (CIWMB 1992), background information
on tire disposal (EPA 1998), and transportation requirements (BTS 2013 and NREL 2015).
Scoring. The overall data quality levels of the 18 sources varied from medium to high. The variation is
due in large part to differences in data collection methods, review process of the studies, and the data
generation and validation methods used by the studies. Of the 18 sources, three could not be located as
they were removed from their original web location due to branding changes by the source or
untraceable written communications that were previously noted as email exchanges. These sources
were: RMA (2010a), RMA (2010b), and Praxair (2009). Due to lack of information, they were given low
data quality values for each DQI, with the exception of data year. The data quality results for tires are
shown in Table 15, and details on the individual sources’ scores can be found in the Appendix. The key
findings for each of these sources are discussed below.
Table 15: Summary of Data Quality Results for Tires Sources
Material
DQ Values by Indicator Grouping
Flow
Reliability
Flow
Represent-
ativeness
Process
Review and
Completeness
Average
Weighted
Average
Tires
Medium
Medium
Medium
Medium
Medium
Note: For details on the indicator subcategories for each indicator grouping, see Section 2: Approach.
Overall, temporal correlation and process review indicators received the lowest data quality values
across the tire data sources, indicating the tires section would benefit from a literature review and data
collection from newer sources that have undergone more extensive review. The average year of
publication for the tires sources was 2004. The two key sources – RMA 2009 and Atech Group 2001 –
had data quality values of medium-high and medium, respectively.
Overall, the tires datasets scored as follows:
• Average indicator: Medium
• Average weighted indicator: Medium
Recommendations
Areas for improvement include:
• Update one of the key data sources for tires with an updated report by RMA on scrap tire
management (released October 2022).
• Identify a recent source on tire process emissions to either corroborate or update the values from
the Atech Group 2001 report.
• Locate replacement studies for those sources that could not be recovered.
• Update those sources with the oldest published dates, most notably CIWMB (1992), NIST (1997) and
EPA (1998).
WARM Data Quality Assessment 48
3.8 Food Waste
Summary of Key Findings
Data Sources. Food waste materials included in WARM include beef, poultry, grains, bread, fruits and
vegetables, and dairy products. The data quality analysis for food waste involved a review of 17 data
sources. Of these, the majority of process energy, process non-energy, and transportation emission
factors data related to food waste rely on eight key data sources, which were weighted more heavily
when assessing data quality due to their importance in WARM calculations:
• Beef
o The report, More Sustainable Beef Optimization Project (Battagliese et al. 2013),
submitted by BASF Corporation, which provides data on production energy and
emissions for cradle to packing plant/case-ready plant gate. (KEY)
o Email correspondence with Thomas Battagliese, BASF (February 2014), which provides
updated data for the study, Battagliese et al. 2013 with revised boundaries. (KEY)
• Poultry
o The journal article, Environmental performance in the US broiler poultry sector: Life cycle
energy use and greenhouse gas, ozone depleting, acidifying and eutrophying emissions,
Pelletier (2008), which provides data on cradle-to-farm gate energy and emission factors
for poultry. (KEY)
o The report, What’s at Steak? Ecological Economic Sustainability and the Ethical,
Environmental, and Policy Implications for Global Livestock Production (Pelletier 2010),
which also provides data on cradle-to-farm gate energy and emission factors for poultry.
(KEY)
• Grains and Bread
o The journal article, The Carbon Footprint of Bread (Espinoza-Orias et al. 2011), which
provides process emission and energy data on bread production. (KEY)
o Estimating Wheat Supply and Food Use, prepared by the U.S. Department of Agriculture
Economic Research Service (USDA 2012a), which provides grains supply data for the
United States. (KEY)
• Fruits and Vegetables
o Comparison of Twelve Organic and Conventional Farming Systems: A Life Cycle
Greenhouse Gas Emissions Perspective (Venkat 2012), which provides data on cradle to
farm GHG emissions from fruits and vegetables production. (KEY)
o UC Davis fruits and vegetables cost production studies (Fake et al. 2009, O’Connell et al.
2009, Stoddard et al. 2007, Wunderlich et al. 2007), which provide production data for
various fruits and vegetables. (KEY)
o A life cycle assessment on bananas, providing banana production data (Luske 2010).
(KEY)
o Ecoinvent 2.0, providing potato production data. (KEY)
• Dairy Products
o Global Warming Potential of Fluid Milk Consumed in the US: A Life Cycle Assessment
(Thoma et al. 2010) of the Innovation Center for U.S. Dairy and University of Arkansas,
which provides process emissions data on milk production. (KEY)
The non-key sources for food waste, including 4 sources that were not used as key sources for a
category, are:

WARM Data Quality Assessment 49
• Grains and Bread
o Nemecek, T., and Kagi, T. (2007). Life Cycle Inventories of Agricultural Production
Systems. Ecoinvent Report No. 15., which provides data on process emissions from grain
drying.
• Fruits and Vegetables
o Apples, Bananas, and Oranges: Using GIS to Determine Distance Travelled, Energy Use,
and Emissions from Imported Fruit (Bernatz 2009), which provides data on energy and
emissions impact from transportation of fruits and vegetables.
• Dairy Products
o Food Availability (per Capita) Data System – 2010, prepared by the U.S. Department of
Agriculture Economic Research Service (USDA 2012b), which provides data on dairy
supply in the United States.
Scoring. Data source analysis was conducted by food waste category, and then averaged to show that,
overall, sources for food waste were of medium to medium-high data quality. A summary of the results
by high level data quality indicators is shown in Table 16. The key findings for each of these sources used
for the different food waste categories are discussed below and details on the individual sources’ scores
can be found in the Appendix.
Table 16: Summary of Data Quality Results for Food Waste Data Sources
Material
DQ Values by Indicator Grouping
Flow
Reliability
Flow
Represent-
ativeness
Process
Review and
Completeness
Average
Weighted
Average
Beef
Medium-high
Medium-high
Medium
Medium-high
Medium-high
Poultry
Medium-high
Medium-high
Medium-high
Medium-high
Medium-high
Grains
High
Medium
High
Medium-high
Medium-high
Bread
High
Medium
High
Medium-high
Medium-high
Fruits &
Vegetables
Medium-high
Medium-high
Medium
Medium
Medium
Dairy Products
Medium-low
Medium
Medium
Medium
Medium
Food Waste (non-
meat)
Medium-high
Medium
Medium-high
Medium
Medium
Food Waste
(meat only)
Medium-high
Medium-high
Medium-high
Medium-high
Medium-high
Food Waste
Medium-high
Medium
Medium-high
Medium-high
Medium-high
Note: For details on the indicator subcategories for each indicator grouping, see Section 2: Approach.
Beef
The WARM emissions factors and energy factors developed for the beef category rely on two sources:
Battagliese et al. (2013), “More Sustainable Beef Optimization Project” and an email correspondence
with Thomas Battagliese (2014). Battagliese et al. (2013) is a key source that provides information on
the cradle-to-plant production process and production transportation emissions of beef. Email
correspondence with Thomas Battagliese (2014) was a communication between ICF and Thomas
Battagliese that provides updated data for the cradle to packing plant/case-ready plant gate process
WARM Data Quality Assessment 50
energy and emission factors in Battagliese et al. (2013) with revised boundaries that no longer consider
retail CED & direct emissions, including removal of transport from that phase.
Battagliese et al. (2013) is a moderately old analysis conducted over ten years ago and has a medium-
high data quality overall due to high and medium-high data quality scores for most flows and process
indicators except third-party reviews (sub-category of Process Review and Completeness Indicators) and
temporal correlation (sub-category of Flow-Representativeness Indicators). The email correspondence
with Thomas Battagliese (2014) also has a medium-high data quality overall due to high and medium-
high data quality scores for most flows and process indicators except process review and temporal
correlation.
Poultry
WARM emissions factors and energy factors for poultry rely on two key sources: Pelletier (2008) and
Pelletier (2010). Both sources provide energy and emission factors for a cradle-to-farm gate analysis of
poultry production. Although both sources are relatively old (2008 and 2010), they have medium-high
data quality overall due to high and medium-high data quality scores for most flows and process
indicators except process review and temporal correlation.
Grains and Bread
Grain and bread food-waste categories rely on the same sources for WARM emissions and energy
factors. Two sources, Espinoza-Orias et al. (2011), “The Carbon Footprint of Bread” and USDA (2012a),
“Estimating Wheat Supply and Food Use” played a key role in understanding life cycle emissions and
energy factors of grains and bread. Other sources included Nemecek and Kagi (2007), Life Cycle
Inventories of Agricultural Production Systems, which provides life cycle inventory data on agricultural
production processes and was used to inform the processing factors for grain drying. Espinoza-Orias et
al. (2011) provided an analysis of the carbon footprint of bread and USDA (2012a) provided wheat
supply and food usage data for the U.S.
Espinoza-Orias et al. (2011) has medium-high data quality overall due to high and medium-high data
quality scores for most flows and process indicators however, it received low data quality scores for
geographical correlation (sub-category of Flow Representativeness Indicators) as it is based in the UK.
USDA (2012a) also has medium-high data quality overall due to high and medium-high data quality
scores for most flows and process indicators, except temporal correlation, as it uses data that is older
than 15 years. Nemecek and Kagi (2007) has medium data quality overall due to low data quality scores
for temporal correlation and geographical correlation as the study is more than 15 years old and its data
is representative of Switzerland.
Fruits and Vegetables
The production energy and emissions factors for fruits and vegetables rely on the following key sources:
Venkat (2012), Comparison of Twelve Organic and Conventional Farming Systems: A Life Cycle
Greenhouse Gas Emissions Perspective, UC Davis fruits and vegetables data, a LCA of bananas (Luske et
al. 2010), and Ecoinvent data for potato production data. Venkat (2012) is a cradle-to-farm analysis
providing life cycle GHG emissions for twelve crop products grown in California through organic and
conventional farming systems. UC Davis fruits and vegetables data obtained from cost production
WARM Data Quality Assessment 51
studies (Fake et al. 2009, O’Connell et al. 2009, Stoddard et al. 2007, Wunderlich et al. 2007) informs
production emissions for fruits and vegetables through research and analysis conducted at UC Davis
using data from 2007-2009. Luske et al. (2010) and Ecoinvent were used for banana and potato
production data, respectively. Bernatz (2009) provides production transportation emissions and energy
factors for fruits and vegetables.
Venkat (2012) reflects medium-high data quality overall due to high and medium-high data quality
scores for most flows and process indicators except temporary correlation and process review, as the
study is more than 10 years old and lacks information on external reviews conducted. UC Davis fruits
and vegetables data (Fake et al. 2009, O’Connell et al. 2009, Stoddard et al. 2007, Wunderlich et al.
2007) reflected medium to medium-low data quality overall due to range of data quality across the
indicators. For each study, the data are currently 14 or more years old and there is a lack of information
on external reviews conducted. Luske (2010) had medium data quality due to a combination of both
higher and lower data quality values across the indicators. It is a comprehensive study with medium-
high to high marks on flow reliability, technological correlation, data collection methods, and process
completeness; however, lower data quality was noted due to the older age of the data and lack of
documentation of a peer review. Ecoinvent Centre (2015) had medium-high data quality due in large
part to their high-quality data generation methods, diligent review process, and recency of publishing.
Bernatz (2009) had high and medium-high data quality values for most flows and process indicators
except temporal correlation and process review, which were both low data quality.
Dairy Products
Thoma et al. (2010), “Global Warming Potential of Fluid Milk Consumed in the US: A Life Cycle
Assessment,” serves as a key source in the development of the life cycle emissions and energy factors
for dairy products. It is a life cycle assessment that estimates the GHG emissions associated with milk
consumed in the United States. Thoma et al. (2010) shows medium-high data quality overall due to high
data quality for most flows and process indicators. The study received a medium-low data value for
temporal correlation as it uses data more than ten years old. The source, USDA (2012b), “Food
Availability (per Capita) Data System – 2010” aided in developing the proportion of food types in the U.S.
waste stream. It had medium-high data quality due to high quality process completeness and data
collection methods.
Overall, the food waste datasets scored as follows:
• Average indicator: Medium
• Average weighted indicator: Medium
Recommendations
Areas for improvement include:
• Update all food waste data sources to more recent sources, where applicable, based on the quality
of the temporal correlation (medium-low or low data quality). Some sources may not have more
recent versions, but updated data should be used if possible.

WARM Data Quality Assessment 52
• Update sources for beef and fruits and vegetables food waste categories to sources that have
information on external reviews, based on the quality of process review (medium-low or low data
quality).
• Replace Nemecek and Kagi (2007) from the sources for grains and bread with a more recent study
that has higher temporal correlation, geographic correlation, and data collection methods. This is
the lowest quality food waste data source.
• Find additional data sources to Thoma et al. (2010) to provide more sources informing life cycle
operations of dairy products.
• Review and consider potential data sources referenced in EPA’s Office of Research and
Development 2021 report “From Farm to Kitchen: Environmental Impacts of Food Waste (Part 1)” as
well as the upcoming release of Part 2.
18
3.9 Yard Trimmings
Summary of Key Findings
Data Sources. The yard trimmings material emission and energy factors calculations rely on seven data
sources for information regarding the different characteristics and treatments of yard trimmings,
including carbon storage calculations, data on biodegradability, and solid waste treatment techniques.
Key data sources for the yard trimmings material pathway in WARM include the following:
• Systematic evaluation of industrial, commercial, and institutional food waste management
strategies in the United States, published in Environmental Science & Technology (Hodge et al.
2016), which evaluates waste management strategies used in the United States and provides
process emission and energy data for waste management pathways of organic waste. (KEY)
• Carbon storage during biodegradation of municipal solid waste components in laboratory-scale
landfills, published in Global Biogeochemical Cycles (Barlaz 1998), which provides data on
carbon storage during biodegradation of yard trimmings.
19
(KEY)
• EPA report, Solid Waste Management and Greenhouse Gases: A Life-Cycle Assessment of
Emissions and Sinks (EPA 2006), which provides life-cycle emissions and energy data for yard
trimmings collection and management. (KEY)
• IPCC Guidelines for National Greenhouse Gas Inventories, Volume 5: Waste, Chapter 3: Solid
Waste Disposal (IPCC 2006), which provides data on N
2
O emissions from combustion of MSW.
(KEY)
18
https://www.epa.gov/land-research/farm-kitchen-environmental-impacts-us-food-waste
19
Barlaz (1998) is also a source for data for the landfill pathway in WARM.

WARM Data Quality Assessment 53
Non-key data sources for the yard trimmings material pathway in WARM include the following:
• The Role of Recycling in Integrated Solid Waste Management to the Year 2000, prepared by
Franklin Associates, Ltd. (FAL 1994), which provides data on transportation emissions.
• EPA report, Advancing Sustainable Materials Management: Facts and Figures 2015 (EPA 2018a),
which provides statistical data on U.S. yard trimmings generation and treatment.
• Landfill Gas Monte Carlo Model Documentation and Results, published by the EPA (Levis and
Barlaz 2014), which provides data on landfill gas collection efficiency.
Scoring. A summary of the results by data quality indicator groupings for yard trimmings is shown in
Table 17Error! Reference source not found.. The key findings for each of these sources are discussed
below.
Table 17: Summary of Data Quality Results for Yard Trimmings Data Sources
Material
DQ Values by Indicator Grouping
Flow
Reliability
Flow
Represent-
ativeness
Process
Review and
Completeness
Average
Weighted
Average
Yard Trimmings
Medium-high
Medium-high
Medium-high
Medium-high
Medium-high
Note: For details on the indicator subcategories for each indicator grouping, see Section 2: Approach.
Hodge et al. (2016) has medium-high data quality overall due to high and medium-high data quality
scores for most flows and process indicators. Although Barlaz (1998) reflects medium-high data quality
overall due to high and medium-high data quality scores for most flows and process indicators, it uses
relatively old data (1998) and has a low data score for temporal correlation (sub-category of Flow
Representativeness Indicators). Both EPA (2006) and IPCC (2006) have medium-high data quality overall
but uses data more than 17 years old and EPA (2006) lacks information on external reviews. Levis &
Barlaz (2014) has medium-high data quality overall due to high and medium-high data quality scores for
most flows and process indicators except process review (sub-category of Process Review and
Completeness Indicators) due to lack of information on external reviews. Both sources, FAL (1994) and
EPA (2018a), reflect medium-high data quality overall due to high and medium-high data quality values
for most flows and process indicators.
Overall, the yard trimmings datasets scored as follows:
• Average indicator: Medium-high
• Average weighted indicator: Medium-high
Additional details on the scoring results from the assessment of the flow level and process level
indicators for the yard trimmings datasets are presented in the Appendix table.

WARM Data Quality Assessment 54
Recommendations
Areas for improvement include:
• Update data sources used from Barlaz (1998) and FAL (1994) to more recent sources, based on the
low data quality of the temporal correlation. Both these sources may not have more recent versions,
but updated data should be used if possible.
4. Assessment of Specific Management Pathway Datasets
The following sections present the results from the assessment of the quality of the datasets and data
sources by management pathway of landfilling, composting, combustion, and anaerobic digestion.
Separate sections are not included for source reduction or recycling as the relevant data sources are
already included under the respective material assessment sections. Summaries of key findings are
presented followed by recommended areas for further research and improvement of the data quality. In
the discussion of data sources, key sources used in the development of the emission and energy factors
are noted as (KEY). They are weighted more heavily for the development of the weighted averages.
Additional details on the scoring results from the assessment of the flow level and process level
indicators for each management pathway data source are presented in the Appendix: Data Quality
Assessment Matrix.
4.1 Landfilling
Summary of Key Findings
Data Sources. To understand landfilling emissions factors, WARM accounts for material composition,
component-specific decay rates, anaerobic decomposition, landfill gas collection, and overall landfill
emissions, including carbon dioxide, methane, and volatile organic compounds. The modeling of the
landfilling waste management pathway in WARM underwent significant revisions in 2013-2014 that
were first incorporated into the June 2014 release of WARM version 13. The management pathway
emissions factors for landfilling rely on a total of 10 sources, including the following five key
government-published or academic peer-reviewed journal articles:
• What is the optimal way for a suburban U.S. city to sustainably manage future solid waste?
Perspectives from a Solid Waste Optimization Life-cycle Framework (SWOLF), published by North
Carolina State University’s Department of Civil, Construction, and Environmental Engineering
(Levis et al. 2013), which provides information on landfill carbon emissions. (KEY)
• Carbon storage during biodegradation of municipal solid waste components in laboratory-scale
landfills, published in Global Biogeochemical Cycles (Barlaz 1998), which provides data on
landfill methane, carbon dioxide, and material decomposition emissions.
20
(KEY)
• Decomposition of Forest Products Buried in Landfills, published in Waste Management (Wang et
al. 2013), which provides insight into material decomposition. (KEY)
20
Barlaz (1998) is also a data source for yard trimmings material emissions factors.

WARM Data Quality Assessment 55
• Estimation of Waste Component-Specific Landfill Decay Rates Using Laboratory-Scale
Decomposition Data, published in Environmental Science & Technology (De la Cruz and Barlaz
2010), which provides component-specific decay rates. (KEY)
• Landfill Gas Monte Carlo Model Documentation and Results, published by the EPA (Levis and
Barlaz 2014), which provides data on landfill gas collection. (KEY)
Five other non-key sources also informed management pathway emissions factors for landfilling:
• Carbon Storage due to Disposal of Biogenic Materials in U.S. Landfills, published in
Environmental Science (Freed et al. 2004), which provides information on anaerobic
decomposition and landfill emissions.
• The Production of Methane from Solid Wastes, published in the Journal of Geophysical Research
(Bingemer and Crutzen 1987), which provides data on landfill carbon dioxide and methane
emissions.
• Characterization of landfill gas composition at the Fresh Kills municipal solid-waste landfill,
published in Environmental Science & Technology (Eklund et al. 1998), which provides
measurement data on volatile organic compounds (VOCs) in landfill gas samples.
• Wood Biodegradation in Laboratory-Scale Landfills, published in Environmental Science
Technology (Wang et al. 2011), which provides information on material decomposition.
• Greenhouse Gas Reporting Program (GHGRP), published on EPA.gov (EPA 2018c), is an EPA
program that requires businesses and others to report data on GHG emissions from major
industrial sources in the United States. It includes estimates on the amount of methane
generated by U.S. landfills.
Scoring. A summary of the results by the high-level data quality indicators is shown in Table 18. The key
findings for each of these sources used for the different landfilling management pathways are discussed
below.
Table 18: Summary of Data Quality Results for Landfilling Data Sources
Management Pathway
DQ Values by Indicator Grouping
Flow
Reliability
Flow
Represent-
ativeness
Process Review
and
Completeness
Average
Weighted
Average
Landfilling
Medium-high
Medium-high
Medium-high
Medium-high
Medium-high
The data quality of these sources was medium-high. On average, the indicator with the highest data
quality was geographical correlation, as many of these sources referenced U.S.-based data. Other high-
quality indicators include process completeness, data collection methods, and technological correlation,
indicating that the landfilling sources represent a large sample of landfilling management pathways,
using a large percentage of flows and technology types.
The lowest quality indicator for landfilling was temporal correlation, which was deemed to be medium-
low quality. Many of these sources are over 10 years old, and several are over 15 years old, giving them

WARM Data Quality Assessment 56
medium-low or low quality temporal correlation. Yet despite this lower quality indicator, the other flow
and process indicators were of medium high quality.
The highest quality sources were two of the key sources, Levis and Barlaz (2014) and Wang et al. (2013),
and one other source, De la Cruz and Barlaz (2010). All of these sources had high data quality scores.
Levis and Barlaz (2014) provided information on landfill gas collection, Wang et al. (2013) focused on
material decomposition, and De la Cruz and Barlaz (2010) focused on component-specific decay rates.
Overall, the landfilling datasets scored as follows:
• Average indicator: Medium-high
• Average weighted indicator: Medium-high
Recommendations
• Update landfilling data sources to more recent sources where applicable, based on the quality of the
temporal correlation (medium-low or low data quality). Some sources may not have more recent
versions, but updated data should be used if possible.
4.2 Composting
Summary of Key Findings
Data Sources. WARM considers fugitive emissions from composted material, emissions from food and
yard waste, the composition of the composting waste stream, and the capacity for carbon storage in
compost-soil for the development of composting emissions factors. The assessment of management
pathway life cycle emissions for composting relies on seven data sources. Four of these sources played a
key role in informing process emissions and weighed more heavily when determining overall data
quality of composting:
• Evaluation of Climate, Energy, and Soils Impacts of Selected Food Discards Management
Systems, published by the State of Oregon Department of Environmental Quality (Oregon
Department of Environmental Quality 2014), which provides information on composting
emissions from food waste. (KEY)
• Impact of Composting Food Waste with Green Waste on Greenhouse Gas Emissions Compost
Windrows, published in Compost Science & Utilization (Williams et al. 2019), which provides
data on fugitive emissions from composted waste. (KEY)
• The Role of Recycling in Integrated Solid Waste Management to the Year 2000, prepared for
Keep America Beautiful, Inc. by Franklin Associates, Ltd. (FAL 1994), which provides
measurements of composting emissions from yard waste. (KEY)
• U.S. Life Cycle Inventory Database, published by the National Renewable Energy Laboratory
(NREL 2015), which provides food and yard waste emissions data.
21
(KEY)
21
The data quality of NREL (2015) was assessed based on information provided in the abstract.

WARM Data Quality Assessment 57
Three non-key sources were also used to provide data on composting process emissions:
• Greenhouse gas emissions from composting and mechanical biological treatment, published in
Waste Management & Research (Amlinger at al. 2008), which provides measurements of
composting GHG emissions.
• Formation and Emission of N2O and CH4 from Compost Heaps of Organic Household Waste,
published in Waste Management & Research (Beck Friis et al. 2000), which provides data on
carbon storage in composted soil.
• EPA’s MSW Facts and Figures (EPA 2014), which informed the composition of the composting
waste stream used in the calculations of the PLA and mixed organics factors.
Two of the above sources were also used to inform other aspects of WARM: Oregon Department of
Environmental Quality (2014) was also a data source for bioplastics, and FAL (1994) was a source for
bioplastics, tires, and combustion.
Scoring. A summary of the results by high level data quality indicators is shown in Table 19Table 18. The
key findings for each of these sources used for the different composting management pathways are
discussed below.
Table 19: Summary of Data Quality Results for Composting Data Sources
Management Pathway
DQ Values by Indicator Grouping
Flow
Reliability
Flow
Represent-
ativeness
Process Review
and
Completeness
Average
Weighted
Average
Composting
Medium-high
Medium
High
Medium-
high
Medium-
high
Note: For details on the indicator subcategories for each indicator grouping, see Section 2: Approach.
The quality of these data sources ranges from medium to high. This is due to high quality indicators,
including flow reliability, process review, and process completeness. Data collection methods, an
indicator under flow-representativeness, was also determined to be high quality, although overall flow
representativeness was deemed to be medium quality, due to low temporal indicator quality.
The lowest quality indicator was temporal correlation, part of the flow representativeness indicators
category, as three of the composting sources are over 15 years old, and one is over 10 years old. This
resulted in composting data sources generally having a medium quality temporal correlation.
The highest quality composting data source was NREL (2015), a high-quality source due to its high-
quality process indicators, data collection methods, and geographic correlation. However, the temporal
correlation was determined to be medium quality, as the source is eight years old, which falls into the
medium quality range of five to ten years old. All other sources had an average indicator quality of high
or medium-high.

WARM Data Quality Assessment 58
Overall, the composting datasets scored as follows:
• Average indicator: Medium-high
• Average weighted indicator: Medium-high
Recommendations
• Update all composting data sources to more recent sources where applicable, based on the quality
of the temporal correlation (medium-low or low data quality). Some sources may not have more
recent versions, but updated data should be used if available.
• Review and consider additional sources that collect and analyze recent data on food waste in the
United States, such as the U.S. EPA’s 2019 Wasted Food Report,
22
which estimates how food waste
is managed across the nation through several pathways, including composting and aerobic
processes. Also review and consider potential data sources referenced in EPA’s Office of Research
and Development 2021 report “From Farm to Kitchen: Environmental Impacts of Food Waste (Part
1)” as well as the upcoming release of Part 2.
23
• Identify another source for the composition of the composting waste stream in the United States as
the EPA Facts and Figures methodology changes.
4.3 Combustion
Summary of Key Findings
Data Sources. The combustion management pathway emissions and energy factors rely on 18 data
sources. Of the sources used for combustion, eight played key roles in determining the energy
consumption and emissions from combustion including:
• The BioCycle report, The State of Garbage in America (Van Haaren et al. 2008), which provides
data on the percentage of textile discards treated with combustion in the United States and the
non-biogenic carbon content of plastic, textiles, rubber and leather. (KEY)
• Climate Change 2007: The Physical Science Basis report (IPCC 2007), which provides N
2
O
emission estimates from MSW combustors. (KEY)
• Environmental impact of producing hardwood lumber using life-cycle inventory, published in
Wood and Fiber Science (Bergman and Bowe 2008), which provides energy content data for
wood flooring combustion. (KEY)
• Mandated Recycling Rates: Impacts on Energy Consumption and Municipal Solid Waste Volume
(Gaines and Stodolsky 1993), which provides data on energy content of specific materials
combusted under the MSW category. (KEY)
22
https://www.epa.gov/facts-and-figures-about-materials-waste-and-recycling/food-material-specific-data
23
https://www.epa.gov/land-research/farm-kitchen-environmental-impacts-us-food-waste
WARM Data Quality Assessment 59
• Estimation of the Effects of Various Municipal Waste Management Strategies on Greenhouse
Gas Emissions (Procter and Redfern, Ltd. & ORTECH International 1993), which provides data on
energy content and emissions of specific materials combusted under the MSW category. (KEY)
• Data Summary of Municipal Solid Waste Management Alternatives (NREL 1992), which provides
data on the energy content of refuse derived fuel (RDF) and combustion system efficiency of
RDF plants. (KEY)
• Project Fire Model. Summary Progress Report-II (Fons et al. 1962), which provides energy
content data for dimensional lumber and fiberboard combustion. (KEY)
• “The role of using carpet as a fuel in carpet recovery system development” (Realff 2010), which
provides energy content data for carpets and tires combustion. (KEY)
An additional source that was used to calculate material recovery from combustion:
• Personal communications between ICF and Covanta Energy (Bahor 2010), which provides data
on amount of steel and ferrous metal recovered per ton of mixed MSW combusted.
Finally, emission factors for transportation of waste and ash were sourced from the following reports:
• FAL’s 1994 The Role of Recycling in Integrated Solid Waste Management to the Year 2000
included transportation energy requirements in WARM calculations (FAL 1994).
• NREL’s 2015 US Life Cycle Inventory Database provided retail transport requirements (NREL
2015).
Six data sources could not be located and thereby were deemed low quality:
• Personal communication between the Fiber Economics Bureau and ICF (DeZan 2000), which
provides data on non-biogenic share of carbon in textiles.
• Incropera, F. P., & DeWitt, D. P. (1990). Introduction to Heat Transfer, Second Edition. New York:
John Wiley & Sons, pp. A3-A4, which provides specific heat data of materials that is used to
calculate the energy content of materials combusted.
• Personal communication with the Integrated Waste Services Association (Zannes 1997), which
provides data on combustion system efficiency of mass burn plants.
• Personal communication with Minnesota Office of Environmental Assistance (Harrington 1997),
which provides data on combustion system efficiency and energy content of RDF.
• The 2000 [Integrated Waste Services Association] IWSA Waste-To-Energy Directory of United
States Facilities (IWSA 2000), which provides data on combustion system efficiency of RDF
plants.

WARM Data Quality Assessment 60
• Personal communication between IWSA, American Ref-Fuel, and ICF (IWSA & American Ref-Fuel
(1997), which provides data on energy content of mixed MSW combusted and losses in
transmission and distribution of electricity specific to WTE combustion facilities.
Scoring. A summary of the results by high level data quality indicators is shown in Table 20Error!
Reference source not found.. The key findings for each of these sources used for the different
combustion management pathways are discussed below.
Table 20: Summary of Data Quality Results for Combustion Data Sources
Material
DQ Values by Indicator Grouping
Flow
Reliability
Flow
Represent-
ativeness
Process
Review and
Completeness
Average
Weighted
Average
Combustion
Medium
Medium
Medium
Medium
Medium
Note: For details on the indicator subcategories for each indicator grouping, see Section 2: Approach.
In general, key sources for combustion had higher data quality results relative to the full set of sources
leading to a slightly higher weighted average data quality value of medium relative to the average across
the data sources of medium-low. Five of the eight key sources (Van Haaren et al. 2008, EPA 2018a, NREL
1992, IPCC 2007, and Bergman and Bowe 2008) had medium-high data quality receiving medium to high
data results for most DQIs; however, they are older sources, which affected their temporal correlation
data quality. NREL (1992), Van Haaren et al. (2008), and EPA (2018a) also lack information on external
reviews giving them low data quality for the process review DQI sub-category. Overall, the data quality
of Gaines and Stodolsky’s (1993) study is medium due to several reasons. Because it is a relatively old
source, it has low data quality for temporal correlation. In addition, it lacks a comprehensive discussion
on data collection methods (sub-category of Flow Representativeness Indicators) and information on
external reviews, which contributes to low data quality for process review. However, it received
medium-high to high data quality results on other DQIs. Procter and Redfern, Ltd. & ORTECH
International (1993) had medium data quality overall with a range of results across the DQIs, receiving
medium high to high data quality results for process completeness, flow reliability and technological
correlation, and low data quality for temporal and geographical correlation. Fons et al. (1962) has
medium data quality overall as it is an old source and lacks a comprehensive discussion on data
collection methods; however, it had medium-high to high data quality for several other DQIs. Details on
the results for other data sources are included in the Appendix: Data Quality Assessment Matrix. The
sources that could not be located were assigned a low data quality score.
Overall, the combustion datasets scored as follows:
• Average indicator: Medium
• Average weighted indicator: Medium
Recommendations
• Update all combustion data sources to more recent sources where applicable, based on the quality
of the temporal correlation (medium, medium-low, or low data quality). Some sources may not have
more recent versions, but updated data should be used if possible.
WARM Data Quality Assessment 61
• Consider contacting authors to confirm whether external or internal reviews occurred where
documentation is lacking on this. If reviews were not conducted, sources should be updated to more
recent versions with reviews or replaced with sources with documentation of external reviews.
4.4 Anaerobic Digestion
Summary of Key Findings
Data Sources. The anaerobic digestion management pathway emissions and energy factors rely on
seven data sources. Of the sources used for combustion, five played key roles in determining the energy
consumption and emissions from anaerobic digestion including:
• Carbon storage during biodegradation of municipal solid waste components in laboratory-scale
landfills (Barlaz 1998), which provides data on carbon storage that occurs during biodegradation
of MSW components in landfills. (KEY)
• Formation and Emission of N
2
O and CH
4
from Compost Heaps of Organic Household Waste
(Beck-Friis et al. 2000), which provides data on nitrous oxide and methane emissions from
compost heaps of organic household waste. (KEY)
• Modelling of environmental impacts from biological treatment of organic municipal waste in
EASEWASTE (Boldrin et al. 2011), which provides data on the environmental impacts of
biological treatment of organic municipal waste. (KEY)
• The Landfill Methane Outreach Program (LMOP) LFGE Benefits Calculator (EPA 2013), which is a
landfill gas energy benefits calculator used to estimate direct, avoided, and total GHG reductions
as well as environmental and energy benefits from a landfill gas (LFG) energy project. (KEY)
• Anaerobic digestion and digestate use: accounting of greenhouse gases and global warming
contribution (Møller et al. 2009), which provides GHG emissions data for anerobic digestion.
(KEY)
An additional source was used to evaluate the chemical composition of material in household waste:
• Chemical composition of material fractions in Danish household waste in Waste Management
(Riber et al. 2009).
Finally, values for GHG emissions resulting from fossil fuels used in vehicles collecting and transporting
waste to the anaerobic digestion facility were sources from:
• NREL’s 2015 US Life Cycle Inventory Database provided retail transport requirements (NREL
2015).

WARM Data Quality Assessment 62
Scoring. A summary of the results by high level data quality indicators is shown in Table 21. The key
findings for each of these sources used for the different anaerobic management pathway are discussed
below.
Table 21: Summary of Data Quality Results for Anaerobic Digestion Data Sources
Material
DQ Values by Indicator Grouping
Flow
Reliability
Flow
Represent-
ativeness
Process Review
and
Completeness
Average
Weighted
Average
Anaerobic Digestion
Medium-high
Medium
Medium-high
Medium-high
Medium
Note: For details on the indicator subcategories for each indicator grouping, see Section 2: Approach.
Among the key sources, EPA (2013) and Barlaz (1998) had overall medium-high data quality. EPA (2013)
had high data quality results for geographical and technological correlation, data collection methods and
process completeness. It had lower data quality for temporal correlation and process review due to the
source being more than ten years old and lacking documentation for external or internal reviews. Barlaz
(1998) had high data quality results for five of the seven DQIs (flow reliability, geographical correlation,
technological correlation, data collection methods, and process completeness). Its low data quality
result was for temporal correlation as it is a relatively old source published more than fifteen years ago.
Boldrin et al. (2013) had an overall medium data quality due to low data scores for temporal and
geographical correlation (sub-categories of Flow Representatives Indicators). The source is over ten
years old and is based in Denmark. Møller et al. (2009) had overall medium data quality with medium-
high to high data quality results for flow reliability, technological correlation, and the process indicators,
and low data quality results for temporal and geographical correlation as it is over ten years old and is
based in Denmark. Beck-Friis et al. (2000) had an overall medium-low data quality as it is a relatively old
source affecting its temporal correlation. Its data quality was low for geographical correlation, data
collection methods (with focus on limited number of compost heaps), and process review.
Overall, the anaerobic digestion datasets scored as follows:
• Average indicator: Medium-high
• Average weighted indicator: Medium-high
Recommendations
• Update all anaerobic digestion data sources to more recent sources where applicable, based on the
quality of the temporal correlation (medium, medium-low, or low data quality) and to sources with
documentation of external reviews. Some sources may not have more recent versions, but updated
data should be used if possible.
5. Conclusion
This report provided a comprehensive assessment of data quality for the numerous data sources used to
develop the emission and energy factors for EPA’s WARM. Table 22 summarizes the results by material
category and management pathway for the DQI indicator groupings as discussed in the previous

WARM Data Quality Assessment 63
sections. In general, overall data quality was found to be medium or medium-high depending on the
material type or pathway, with the exception of glass, paper, and carpet.
Table 22: Summary of Data Quality Results by Material Type or Management Pathway
Material or Pathway
DQ Values by Indicator Grouping
Flow
Reliability
a
Flow
Represent-
ativeness
b
Process
Review and
Completeness
c
Average
d
Weighted
Average
e
Material Category
Plastics
Medium-high
Medium-high
Medium
Medium-high
Medium-high
Bioplastics
Medium-high
Medium
Medium-high
Medium-high
Medium-high
Metals
Medium
Medium
Medium
Medium
Medium
Glass
Medium
Medium
Medium
Medium
Medium-low
Paper
Medium-low
Medium
Medium-low
Medium-low
Medium
Electronics
Medium-high
Medium-high
Medium-high
Medium-high
Medium-high
Construction Materials
Medium-high
Medium-high
Medium-high
Medium-high
Medium-high
Asphalt Concrete
Medium-high
Medium
Medium-high
Medium-high
Medium
Asphalt Shingles
Medium-low
Medium
Medium
Medium
Medium
Carpet
Medium
Medium-low
Medium-low
Medium-low
Medium
Clay Bricks
Medium-high
Medium-high
High
Medium-high
High
Concrete
High
Medium-high
Medium
Medium-high
Medium-high
Dimensional Lumber
Medium-high
Medium-high
High
Medium-high
Medium-high
Drywall
Medium-high
Medium-high
Medium-high
Medium-high
Medium-high
Fiberglass Insulation
Medium
Medium
Medium
Medium
Medium
Fly Ash
Medium-high
Medium-high
Medium
Medium-high
Medium-high
Medium-density
Fiberboard
Medium-high
Medium-high
High
Medium-high
Medium-high
Structural Steel
Medium-high
Medium-high
Medium-high
Medium-high
Medium-high
Vinyl Flooring
Medium-high
Medium
Medium-high
Medium
Medium
Wood Flooring
Medium-high
Medium
Medium-high
Medium-high
Medium-high
Tires
Medium
Medium
Medium
Medium
Medium
Food Waste (non-meat)
Medium-high
Medium
Medium-high
Medium
Medium
Food Waste (meat)
Medium-high
Medium-high
Medium-high
Medium-high
Medium-high
Yard Trimmings
Medium-high
Medium-high
Medium-high
Medium-high
Medium-high
Management Pathway
f
Landfilling
Medium-high
Medium-high
Medium-high
Medium-high
Medium-high
Composting
Medium-high
Medium
High
Medium-high
Medium-high
Combustion
Medium
Medium-low
Medium
Medium
Medium
Anaerobic Digestion
Medium-high
Medium
Medium-high
Medium-high
Medium
a
Refers to data generation method and verification.
b
Includes temporal correlation (data year), geographical correlation (region of data), technological correlation (technology type,
scale), and data collection methods (representativeness, sample size).
c
Includes process review (third party or internal reviewers) and process completeness (percent of flows covered).
d
Average of all indicators.
e
Developed to give additional weight to the key data sources informing the emission factor estimates.
f
Separate data quality assessments for source reduction and recycling were not conducted as their data sources were already
captured under the material-specific data assessments.

WARM Data Quality Assessment 64
This assessment identified a number of areas for improvements to update the underlying datasets that
would improve the factors in WARM. These were described in each material and pathway subsection. A
few overarching recommendations include the following:
• Identify more recent data sources for several materials and ensure that any updated
publications are used.
• Prioritize the identification of publicly-available data sources.
• Identify published data sources to update certain data inputs.
• Prioritize updates to the modeling of glass, paper, metals, food waste (non-meat), carpet,
asphalt shingles, fiberglass insulation, vinyl flooring, tires, and combustion based on both the
average and weighted average data quality results for those categories, which fell below those
of the other material or management pathway categories.
• Improve the archiving, referencing, and accessibility of the underlying data sources.
• Communicate the DQA findings alongside the WARM documentation.
6. References
Introduction and Approach
Edelen, A. and W. Ingwersen. Guidance on Data Quality Assessment for Life Cycle Inventory Data. U.S.
Environmental Protection Agency, Washington, DC, EPA/600/R-16/096, 2016.
https://cfpub.epa.gov/si/si_publicrecord_Report.cfm?Lab=NRMRL&dirEntryId=321834.
H.R.4174 – 115th Congress (2017-2018): Foundations for Evidence-Based Policymaking Act of 2019.
Congress.gov, Library of Congress, January 14, 2019. https://www.congress.gov/bill/115th-
congress/house-bill/4174.
EPA (2000). Guidance for Data Quality Assessment: Practical Methods for Data Analysis. (EPA/600/R-
96/084). Washington, DC United States Environmental Protection Agency.
Plastics and Bioplastics
BTS (2013). Commodity Flow Survey Preliminary Tables. Table 1: Shipment Characteristics by Mode of
Transportation for the United States: 2012. Washington, DC: U.S. Bureau of Transportation
Statistics, Research and Innovative Technology Administration. Retrieved from
http://www.rita.dot.gov/bts/sites/rita.dot.gov.bts/files/publications/commodity_flow_survey/2
012/united_states/table1.html.
FAL (1994). The Role of Recycling in Integrated Solid Waste Management to the Year 2000. Franklin
Associates, Ltd. (Stamford, CT: Keep America Beautiful, Inc.), September, pp. I-24.
FAL (2011). Cradle-to-Gate Life Cycle Inventory of Nine Plastic Resins and Two Polyurethane Precursors.
Revised Final Report. Prairie Village, KS: Franklin Associates, Ltd.
FAL (2018). Life Cycle Impacts for Postconsumer Recycled Resins: PET, HDPE, and PP. December 2018.
Conducted by Franklin Associates for APR. Available at
https://plasticsrecycling.org/images/apr/2018-APR-Recycled-Resin-Report.pdf

WARM Data Quality Assessment 65
NatureWorks. (2010). Responses to Preliminary Review of NatureWorks polylactide biopolymer (PLA) LCI
Data memo. Correspondence between Erwin Vink, NatureWorks LLC and ICF International. July
28, 2010.
Oregon Department of Environmental Quality (DEQ) (2014). Evaluation of Climate, Energy, and Soils
Impacts of Selected Food Discards Management Systems. Available online at:
https://www.oregon.gov/deq/FilterDocs/FoodWasteStudyReport.pdf
U.S. LCI. (2010). US LCI Database spreadsheet “SS Polylactide Biopolymer Resin_US LCI May_2010.xls”.
NatureWorks, LLC. Received by ICF International from Natureworks LLC. May 18, 2010.
Metals
BTS (2013). Commodity Flow Survey Preliminary Tables. Table 1: Shipment Characteristics by Mode of
Transportation for the United States: 2012. Washington, DC: U.S. Bureau of Transportation
Statistics, Research and Innovative Technology Administration. Retrieved from
http://www.rita.dot.gov/bts/sites/rita.dot.gov.bts/files/publications/commodity_flow_survey/2
012/united_states/table1.html.
EPA (2018). Advancing Sustainable Materials Management: Facts and Figures 2015. (EPA530-F-18-004).
Washington, DC: U.S. Government Printing Office. Retrieved from https://www.epa.gov/facts-
and-figures-about-materials-waste-and-recycling/advancing-sustainable-materials-
management.
EPA (1998a). Greenhouse Gas Emissions from Management of Selected Materials in Municipal Solid
Waste. Background Document A: A Life Cycle of Process and Transportation Energy for Eight
Different Materials. Prairie Village, KS: Franklin Associates, Ltd.
EPA (1998b). Greenhouse Gas Emissions from the Management of Selected Materials. (EPA publication
no. EPA530-R-98-013.) Washington, DC.
FAL (2003a): Personal communication between Randy Freed, ICF International and William E. Franklin,
Franklin Associates Limited regarding recycled contents for use in the ReCon Tool. December 10,
2003.
FAL (2003b). Loss rates provided by in-house data from Franklin Associates, Ltd., Prairie Village, KS.
FAL (2002). Energy and Greenhouse Gas Factors for Personal Computers. Final Report. Prairie Village, KS:
Franklin Associates, Ltd. August 7, 2002.
FAL (1998). Greenhouse Gas Emissions from Management of Selected Materials in Municipal Solid
Waste. Background Document A, Attachment 1: A Partial Life Cycle Inventory of Process and
Transportation Energy for Boxboard and Paper Towels. Prairie Village, KS: Franklin Associates,
Ltd.
PE Americas (2011). Disaggregated inputs to the PE Americas (2010) report, in the spreadsheet titled
“Data for ICF-EPA_ICF formatted 08-04-11.”
PE Americas (2010). Life Cycle Impact Assessment of Aluminum Beverage Cans. https://www.container-
recycling.org/assets/pdfs/aluminum/LCA-2010-AluminumAssoc.pdf.

WARM Data Quality Assessment 66
RTI (2004). Unpublished database developed jointly by the Research Triangle Institute and the U.S.
Environmental Protection Agency Office of Research and Development.
Tellus (1998). Background Document B: Methodology for Estimating the Amounts and Types of Energy
Consumed in Raw Materials Acquisition and Manufacturing of Eight Different Materials,
Greenhouse Gas Emissions from Management of Selected Materials in Municipal Solid Waste.
Washington DC: United States Environmental Protection Agency, prepared by the Tellus
Institute.
USGS (2004). Flows of Selected Materials Associated with World Copper Smelting. (USGS Open-File
Report 2004-1395.) Washington, DC: U.S. Geological Survey.
Glass
BTS (2013). Commodity Flow Survey Preliminary Tables. Table 1: Shipment Characteristics by Mode of
Transportation for the United States: 2012. Washington, DC: U.S. Bureau of Transportation
Statistics, Research and Innovative Technology Administration. Retrieved from
http://www.rita.dot.gov/bts/sites/rita.dot.gov.bts/files/publications/commodity_flow_survey/2
012/united_states/table1.html.
DOE (2002). Energy and Environmental Profile of the U.S. Glass Industry. Washington, DC: U.S.
Department of Energy, Office of Industrial Technologies.
EPA (1998b). Greenhouse Gas Emissions from the Management of Selected Materials. (EPA publication
no. EPA530-R-98-013.) Washington, DC: U.S. Environmental Protection Agency, Municipal and
Industrial Solid Waste Division.
FAL (2003b). Loss rates provided by in-house data from Franklin Associates, Ltd., Prairie Village, KS.
FAL (1994). The Role of Recycling in Integrated Solid Waste Management to the Year 2000. Franklin
Associates, Ltd. (Stamford, CT: Keep America Beautiful, Inc.), September, pp. I-24.
RTI (2004). Unpublished database developed jointly by the Research Triangle Institute and the U.S.
Environmental Protection Agency Office of Research and Development.
Paper
BTS. (2013). US Census Commodity Flow Survey Preliminary Tables. Table 1: Shipment Characteristics by
Mode of Transportation for the United States: 2007. Washington, DC: U.S. Bureau of
Transportation Statistics, Research and Innovative Technology Administration. Retrieved from
http://www.rita.dot.gov/bts/sites/rita.dot.gov.bts/files/publications/commodity_flow_survey/2
012/united_states/table1.html
EPA. (2015). Inventory of U.S. Greenhouse Gas Emissions and Sinks: 1990 – 2013. (EPA 430-R-15-004).
Washington, DC: U.S. Government Printing Office. Retrieved from
http://www3.epa.gov/climatechange/Downloads/ghgemissions/US-GHG-Inventory-2015-Main-
Text.pdf.
EPA. (1998a). Greenhouse Gas Emissions from Management of Selected Materials in Municipal Solid
Waste. Background Document A: A Life Cycle of Process and Transportation Energy for Eight

WARM Data Quality Assessment 67
Different Materials. Washington DC: U.S. Environmental Protection Agency, Office of Solid
Waste, prepared by Franklin Associates, Ltd.
FAL (2003a): Personal communication between Randy Freed, ICF International and William E. Franklin,
Franklin Associates Limited regarding recycled contents for use in the ReCon Tool. December 10,
2003.
FAL (2003b). Loss rates provided by in-house data from Franklin Associates, Ltd., Prairie Village, KS.
FAL. (1998). Greenhouse Gas Emissions from Management of Selected Materials in Municipal Solid
Waste. Background Document A, Attachment 1: A Partial Life Cycle Inventory of Process and
Transportation Energy for Boxboard and Paper Towels. Prairie Village, KS: Franklin Associates,
Ltd.
RTI. (2004). Unpublished database developed jointly by the Research Triangle Institute and the U.S.
Environmental Protection Agency Office of Research and Development.
Electronics
Andrea, A.S.G. and Vaija, M.S. (2014). To Which Degree Does Sector Specific Standardization Make Life
Cycle Assessments Comparable? —The Case of Global Warming Potential of Smartphones.
Challenges. 5(2), 409-429. Available at: https://www.mdpi.com/2078-1547/5/2/409/htm.
Argonne National Laboratory (ANL). (2018). Greenhouse gases, Regulated Emissions, and Energy use in
Transportation (GREET) Model. GREET 2018 version. Available at: https://greet.es.anl.gov/.
Babbitt, C.W., Althaf, S., and Chen R. (2017). Sustainable Materials Management for the Evolving
Consumer Technology Ecosystem. Available at:
https://www.rit.edu/gis/ssil/docs/Final%20Report%20SMM%20Phase%201%202017.pdf.
Accessed January 24, 2018.
Bigum, M., Brogaard, L., and Christensen, T.H. (2012). Metal recovery from high-grade WEEE: A life cycle
assessment. Journal of Hazardous Materials. 207-208: 8-14. Available at:
https://www.sciencedirect.com/science/article/pii/S0304389411012283.
Dewulf, J., Van der Vorst, G., Denturk, K., Van Langenhove, H., Ghyoot, W., Tytgat, J., and Vandeputte, K.
(2010). Recycling rechargeable lithium ion batteries: Critical analysis of natural resource savings.
Resources, Conservation and Recycling. 54(4): 229-234. Available at:
https://www.sciencedirect.com/science/article/pii/S0921344909001815.
Ecoinvent Centre. (2015). Ecoinvent data v3.2. Ecoinvent reports No.1-25, Swiss Centre for Life Cycle
Inventories, Dübendorf, 20015. Retrieved from: www.ecoinvent.org.
EPA. (2018). Advancing Sustainable Materials Management: Facts and Figures 2015. (EPA530-F-18-004).
Washington, DC: U.S. Government Printing Office. Retrieved from https://www.epa.gov/facts-
and-figures-about-materials-waste-and-recycling/advancing-sustainable-materials-
management.
EPA. (2008). Electronics Waste Management in the United States: Approach I. (EPA publication no.
EPA530-R-07-004b.) Washington, DC: U.S. Environmental Protection Agency.

WARM Data Quality Assessment 68
FAL. (2018). Life Cycle Impacts for Postconsumer Recycled Resins: PET, HDPE, and PP. December 2018.
Conducted by Franklin Associates for APR. Available at
https://plasticsrecycling.org/images/apr/2018-APR-Recycled-Resin-Report.pdf
FAL. (2011a). Cradle-to-Gate Life Cycle Inventory of Nine Plastic Resins and Two Polyurethane Precursors.
Revised Final Report. Prairie Village, KS: Franklin Associates, Ltd.
FAL. (2011b). Life Cycle Inventory of 100% Postconsumer HDPE and PET Recycled Resin from
Postconsumer Containers and Packaging. Prairie Village, KS: Franklin Associates, Ltd.
FAL. (2002). Energy and Greenhouse Gas Factors for Personal Computers. Final Report. Prairie Village,
KS: Franklin Associates, Ltd. August 7, 2002.
Hikwama, B.P. (2005). Life Cycle Assessment of a Personal Computer. October 2005. Available online at:
https://eprints.usq.edu.au/492/1/BaipakiPaksonHIKWAMA-2005.pdf
Mars, C., Nafe, C., and Linnell, J. (2016). The Electronics Recycling Landscape Report. Prepared for the
Closed Loop Foundation. May 2016. Available at:
https://www.sustainabilityconsortium.org/downloads/tsc-electronics-recycling-landscape-
report/.
Teehan, P. and Kandlikar, M. (2013). Comparing embodies greenhouse gas emissions of modern
computing and electronics products. Environmental Science and Technology. 47(9): 3997-4003.
Available at: https://www.ncbi.nlm.nih.gov/pubmed/23458212.
Turner, D.A., Williams, I.D., Kemp, S. (2015). Greenhouse gas emission factors for recycling of source-
segregated waste materials. Resources, Conservation and Recycling. 105(2015): 186-197.
Available at: https://www.sciencedirect.com/science/article/pii/S0921344915301245.
Vanegas, P., Peeters, J.R., Dewulf, W., Cattrysse D., and Duflou, J.R. (2015). Improving Resource
Efficiency through Recycling Modelling: A Case Study for LCD TVs. Procedia CIRP. 26 (2015): 601-
606. Available at: https://www.sciencedirect.com/science/article/pii/S2212827114009020
Construction Materials
Asphalt Concrete
Athena Sustainable Materials Institute. (2001). A Life Cycle Inventory for Road and Roofing Asphalt.
Prepared by: Franklin Associates Ottawa, Canada. March 2001.
Canadian Industry Program for Energy Conservation. (2005). Road Rehabilitation Energy Reduction
Guide for Canadian Road Builders. Canadian Construction Association.
Hassan, M. (2009). Life-Cycle Assessment of Warm-Mix Asphalt: An Environmental and Economic
Perspective. Louisiana State University.
Levis, J. W. (2008). A Life-Cycle Analysis of Alternatives for the Management of Waste Hot-Mix Asphalt,
Commercial Food Waste, and Construction and Demolition Waste. Raleigh: North Carolina State
University.

WARM Data Quality Assessment 69
NREL. (2009). U.S. Life-Cycle Inventory Database. National Renewable Energy Laboratory. Retrieved
September 8, 2009 from http://www.nrel.gov/lci/.
US Census Bureau. (1997). Economic Census, Mining—Subject Series, Product Summary. US Census
Bureau. www.census.gov/prod/ec97/97n21s-ps.pdf
Asphalt Shingles
Athena Sustainable Materials Institute. (2000). Life Cycle Analysis of Residential Roofing Products.
Prepared by George J. Venta and Michael Nisbet. Ottawa.
Berenyi, E. (2007). Materials Recycling and Processing in the United States, Fifth Edition. Yearbook and
Directory. Westport, CT: Governmental Advisory Associates, Inc.
CMRA. (2007). Environmental Issues Associated with Asphalt Shingle Recycling. Gainesville, FL:
Innovative Waste Consulting Services, LLC, prepared for the Construction Materials Recycling
Association, October. Retrieved from http://www.p2pays.org/ref/42/41583.pdf.
Cochran, K. (2006). Construction and Demolition Debris Recycling: Methods, Markets, and Policy.
Gainesville: University of Florida, Environmental Engineering Department.
Carpet
EPA (2003a). Background Document for Life-Cycle Greenhouse Gas Emission Factors for Carpet and
Personal Computers. EPA530-R-03-018. November 21, 2003.
FAL. (2002). Energy and Greenhouse Gas Factors for Personal Computers. Final Report. Prairie Village,
KS: Franklin Associates, Ltd. August 7, 2002.
Plastics Europe. (2005a). Eco-profiles of the Plastics Industry—Polyamide (Nylon 6). Brussels, Belgium:
Plastics Europe. March 2005.
Plastics Europe. (2005b). Eco-profiles of the Plastics Industry—Polyamide (Nylon 66). Brussels, Belgium:
Plastics Europe. March 2005.
Realff, M. (2011). Personal communication with Matthew Realff, Associate Professor of Chemical and
Biomolecular Engineering, Georgia Tech, September 15, 2011.
Clay Bricks
Athena. (1998). Life Cycle Analysis of Brick and Mortar Products. Merrickville, ON: The Athena
Sustainable Materials Institute, September.
EPA. (2018b). Inventory of U.S. Greenhouse Gas Emissions and Sinks: 1990 – 2016. (EPA 430-R-18-003).
Washington, DC: U.S. Government Printing Office. Retrieved from
https://www.epa.gov/ghgemissions/inventory-us-greenhouse-gas-emissions-and-sinks-1990-
2016.
Concrete
EPA. (2003b). Background Document for Life-Cycle Greenhouse Gas Emission Factors for Clay Brick Reuse
and Concrete Recycling. EPA530-R-03-017. Washington, DC: U.S. Environmental Protection
Agency. November 7, 2003.

WARM Data Quality Assessment 70
Wilburn, D., & Goonan, T. (1998). Aggregates from Natural and Recycled Sources–Economic
Assessments for Construction Applications. U.S. Geological Survey Circular 1176. Retrieved from
http://pubs.usgs.gov/circ/1998/c1176/c1176.html.
Dimensional Lumber
American Wood Council. (2013). Environmental Product Declaration: North American Softwood Lumber.
American Wood Council. https://awc.org/pdf/greenbuilding/epd/AWC-EPD-SoftwoodLumber-
190328.pdf.
Bergman, Richard D.; Falk, Robert H.; Gu, Hongmei; Napier, Thomas R.; Meil, Jamie. (2013). Life-cycle
energy and GHG emissions for new and recovered softwood framing lumber and hardwood
flooring considering end-of-life scenarios. Res. Pap. FPL-RP-672. Madison, WI: U.S. Department
of Agriculture, Forest Service, Forest Products Laboratory. 35 p.
https://www.fs.usda.gov/treesearch/pubs/43547.
Drywall
BTS. (2013). US Census Commodity Flow Survey Preliminary Tables. Table 1: Shipment Characteristics by
Mode of Transportation for the United States: 2007. Washington, DC: U.S. Bureau of
Transportation Statistics, Research and Innovative Technology Administration. Retrieved from
http://www.rita.dot.gov/bts/sites/rita.dot.gov.bts/files/publications/commodity_flow_survey/2
012/united_states/table1.html.
FAL. (2007). Cradle-to-Gate Life Cycle Inventory of Nine Plastic Resins and Two Polyurethane Precursors.
Prepared for the Plastics Division of the American Chemistry Council, by Franklin Associates,
Eastern Research Group, Inc. December 2007.
U.S. Census Bureau. (2004). 2002 Commodity Flow Survey. U.S. Economic Census. Washington, DC: U.S.
Census Bureau, December.
Venta, G. (1997). Life Cycle Analysis of Gypsum Board and Associated Finishing Products. Ottawa: Athena
Sustainable Materials Institute, March.
Staley, B. F. and Barlaz, M. A. (2009). Composition of Municipal Solid Waste in the United States and
Implications for Carbon Sequestration and Methane Yield. Journal of Environmental Engineering,
135 (10), 901–909. doi: 10.1061/(ASCE)EE.1943-7870.0000032.
WRAP. (2008). Comprehensive life-cycle analysis of RAP: Comprehensive life-cycle analysis of
plasterboard. Waste & Resources Action Programme. United Kingdom. May 2008. Retrieved
from
http://www.ct.gov/deep/lib/deep/waste_management_and_disposal/solid_waste_managemen
t_plan/gypsumwallboard/jan2010/wrap_-_comprehensive_life-
cycle_analysis_of_plasterboard_may_2008.pdf.
Fiberglass Insulation
Athena Sustainable Materials Institute. (2000). Life Cycle Analysis of Residential Roofing Products.
Prepared by George J. Venta and Michael Nisbet. Ottawa.

WARM Data Quality Assessment 71
BTS. (2013). US Census Commodity Flow Survey Preliminary Tables. Table 1: Shipment Characteristics by
Mode of Transportation for the United States: 2007. Washington, DC: U.S. Bureau of
Transportation Statistics, Research and Innovative Technology Administration. Retrieved from
http://www.rita.dot.gov/bts/sites/rita.dot.gov.bts/files/publications/commodity_flow_survey/2
012/united_states/table1.html.
Enviros Consulting. (2003). Glass Recycling–Life Cycle Carbon Dioxide Emissions. Prepared by Enviros
Consulting, Limited for the British Glass Manufacturers Confederation, Public Affairs Committee,
November.
Lippiatt, B. (2007). Building for Environmental and Economic Sustainability (BEES). Retrieved February
13, 2009, from http://www.nist.gov/el/economics/BEESSoftware.cfm/.
Miller, S. (2010). Email communication with Scott Miller, Knauf Insulation, and Beth Moore, ICF
International. February 14, 2010.
NREL. (2009). U.S. Life-Cycle Inventory Database. National Renewable Energy Laboratory. Retrieved
September 8, 2009 from http://www.nrel.gov/lci/.
Fly Ash
EPA. (2003c). Background Document for Life-Cycle Greenhouse Gas Emission Factors for Fly Ash Used as
a Cement Replacement in Concrete. Washington, DC: U.S. Environmental Protection Agency,
November 7, 2003. (EPA publication no. EPA530-R-03-016.) Retrieved from:
http://www.epa.gov/climatechange/wycd/waste/downloads/FlyAsh_11_07.pdf.
Medium-density Fiberboard
Composite Panel Association. (2018). Environmental Product Declaration. North American MDF
https://awc.org/pdf/greenbuilding/epd/AWC-EPD-MDF-190501.pdf.
Wilson, J. B. (2010). Life-cycle inventory of medium density fiberboard in terms of resources, emissions,
energy and carbon. Wood and Fiber Science, 42, 107-124.
https://wfs.swst.org/index.php/wfs/article/viewFile/706/706.
Structural Steel
American Institute of Steel Construction. (2016). Fabricated Structural Steel – Environmental product
declaration supporting background report. American Institute of Steel Construction.
American Iron and Steel Institute. (2017). Structural Section and Hot-Dip Galvanized Steel Production in
China – Life cycle assessment report. American Institute of Steel Construction.
BTS. (2013). US Census Commodity Flow Survey. Table 1: CFS Preliminary Report: Shipment
Characteristics by Mode of Transportation for the United States: 2012. Washington, DC: U.S.
Bureau of Transportation Statistics, Research and Innovative Technology Administration.
Retrieved from:
http://www.rita.dot.gov/bts/sites/rita.dot.gov.bts/files/publications/commodity_flow_survey/2
012/united_states/table1.html.
EPA. (1998b). Greenhouse Gas Emissions from the Management of Selected Materials. (EPA publication
no. EPA530-R-98-013.) Washington, DC: U.S. Environmental Protection Agency.

WARM Data Quality Assessment 72
U.S. Department of Commerce. (2020). Global Steel Trade Monitor. U.S. Department of Commerce.
Retrieved from: https://legacy.trade.gov/steel/countries/pdfs/imports-us.pdf.
World Steel Association. (2020). 2020 World Steel Figures. World Steel Association. Retrieved from:
https://www.worldsteel.org/en/dam/jcr:f7982217-cfde-4fdc-8ba0-
795ed807f513/World%2520Steel%2520in%2520Figures%25202020i.pdf.
Vinyl Flooring
Baitz, M., Kreißig, J., Byrne, E., Makishi, C., Kupfer, T., Frees, N., et al. (2004). Life Cycle Assessment of
PVC and of principal competing materials. European Commission (EC). Retrieved from
http://ec.europa.eu/enterprise/chemicals/sustdev/pvc-final_report_lca.pdf.
BTS. (2013). US Census Commodity Flow Survey Preliminary Tables. Table 1: Shipment Characteristics by
Mode of Transportation for the United States: 2007. Washington, DC: U.S. Bureau of
Transportation Statistics, Research and Innovative Technology Administration. Retrieved from
http://www.rita.dot.gov/bts/sites/rita.dot.gov.bts/files/publications/commodity_flow_survey/2
012/united_states/table1.html.
ECOBILAN. (2001). Eco-profile of high volume commodity phthalate esters (DEHP/DINP/DIDP). La
Défense, France: ECOBILAN, prepared for The European Council of Plasticisers and
Intermediates (ECPI).
FAL. (2007). Cradle-to-Gate Life Cycle Inventory of Nine Plastic Resins and Two Polyurethane Precursors.
Prepared for the Plastics Division of the American Chemistry Council, by Franklin Associates,
Eastern Research Group, Inc. December 2007.
Jones, Shelia (1999). Resilient Flooring: A Comparison of Vinyl, Linoleum and Cork. Georgia Tech
Research Institute. Retrieved from
file://icfi.icfconsulting.com/Share/RemoteOffices/DC02/Common/Common/MSW/Material%20
Data,%20Analysis/Construction%20and%20Demolition%20LCI/Flooring%20-
%20Vinyl/jones_99_resilient_flooring.pdf
Lippiatt, B. (2007). Building for Environmental and Economic Sustainability (BEES). Retrieved February
13, 2009, from http://www.nist.gov/el/economics/BEESSoftware.cfm/.
Wood Flooring
American Wood Council. (2013). Environmental Product Declaration: North American Softwood Lumber.
American Wood Council. https://awc.org/pdf/greenbuilding/epd/AWC-EPD-SoftwoodLumber-
190328.pdf.
Athena Sustainable Materials Institute. (2000). Life Cycle Analysis of Residential Roofing Products.
Prepared by George J. Venta and Michael Nisbet. Ottawa.
Bergman, R.D. and Bowe, S.A. (2008). Environmental Impact of Producing Hardwood Lumber Using Life-
Cycle Inventory. Wood and Fiber Science, 40(3), 448-458.
Bergman, R.D.; Falk, R.H.; Gu, H.; Napier, T.R.; Meil, J. (2013). Life-cycle energy and GHG emissions for
new and recovered softwood framing lumber and hardwood flooring considering end-of-life

WARM Data Quality Assessment 73
scenarios. Res. Pap. FPL-RP-672. Madison, WI: U.S. Department of Agriculture, Forest Service,
Forest Products Laboratory. 35 p. https://www.fs.usda.gov/treesearch/pubs/43547
BTS. (2013). US Census Commodity Flow Survey Preliminary Tables. Table 1: Shipment Characteristics by
Mode of Transportation for the United States: 2007. Washington, DC: U.S. Bureau of
Transportation Statistics, Research and Innovative Technology Administration. Retrieved from
http://www.rita.dot.gov/bts/sites/rita.dot.gov.bts/files/publications/commodity_flow_survey/2
012/united_states/table1.html.
Hubbard, S.S. and Bowe, S.A. (2008). Life-Cycle Inventory of Solid Strip Hardwood Flooring in the Eastern
United States. CORRIM: Phase II Final Report.
https://www.woodfloors.org/LCA_solid_wood_FINAL_REPORT.pdf.
Tires
Atech Group. (2001). A National Approach to Waste Tyres. Prepared for Environment Australia, June.
BTS. (2013). US Census Commodity Flow Survey Preliminary Tables. Table 1: Shipment Characteristics by
Mode of Transportation for the United States: 2007. Washington, DC: U.S. Bureau of
Transportation Statistics, Research and Innovative Technology Administration. Retrieved from
http://www.rita.dot.gov/bts/sites/rita.dot.gov.bts/files/publications/commodity_flow_survey/2
012/united_states/table1.html
CIWMB. (1992). Tires as a fuel supplement: Feasibility study: Report to Legislature. Sacramento:
California Integrated Waste Management Board.
Corti, A., & Lombardi, L. (2004). End life tyres: Alternative final disposal processes compared by LCA.
Energy, 29 (12–15), 2089–2108. Doi: 10.1016/j.energy.2004.03.014
EIA. (2009). 2006 Manufacturing Energy Consumption Survey, Table 3.2: Fuel Consumption, 2006 for
Synthetic Rubber. (NAICS 325212.) Washington, DC: Department of Energy, Energy Information
Administration.
EPA. (1998). Greenhouse Gas Emissions from the Management of Selected Materials. (EPA publication
no. EPA530-R-98-013.) Washington, DC: U.S. Environmental Protection Agency, Municipal and
Industrial Solid Waste Division.
FAL. (1994). The Role of Recycling in Integrated Solid Waste Management to the Year 2000. Franklin
Associates, Ltd. (Stamford, CT: Keep America Beautiful, Inc.), September, pp. I-24.
ICF. (2006). Life-Cycle Greenhouse Gas Emission Factors for Scrap Tires.
National Renewable Energy Laboratory (2015). “U.S. Life Cycle Inventory Database.” Retrieved from
https://www.lcacommons.gov/nrel/search
Nevada Automotive Test Center. (2004). Increasing the Recycled Content in New Tires.
NIST. (1997). MEP Environmental Program, Best Practices in Scrap Tires & Rubber Recycling.
Gaithersburg, MD: National Institute of Standards and Technology, prepared for the Recycling
Technology Assistance Partnership, June, p. 89

WARM Data Quality Assessment 74
Pimentel D., Pleasant, A., Barron, J., Gaudioso, J., Pollock, N., Chae, E., Kim, Y., Lassiter, A., Schiavoni, C.,
Jackson, A., Lee, M., and Eaton, A. (2002). U.S. Energy Conservation and Efficiency: Benefits and
Costs. Ithaca, NY: Cornell University, College of Agriculture and Life Sciences.
Praxair. (2009). Cryogenic Grinding Technology. Accessed 3/23/2009 from
http://www.praxair.com/praxair.nsf/7a1106cc7ce1c54e85256a9c005accd7/97cc431d7370411f
85256e6d00543a12?OpenDocument.
Rubber Manufacturers Association, RMA. (2010a). Facts at a Glance: How a Tire is Made. Washington,
DC: Rubber Manufacturers Association. Retrieved June 23, 2010, from http://www.rma.org/tire-
safety/tire-basics/.
RMA. (2010b). Personal email communication between Michael Blumenthal at the Rubber
Manufacturers’ Association with Veronica Kennedy, ICF International, April 2010.
RMA. (2009a). Scrap Tire Markets in the United States: 9
th
Biennial Report. May 2009.
RMA. (2009b). Scrap Tire Markets: Facts and Figures – Scrap Tire Characteristics. Washington, DC:
Rubber Manufacturers Association. Retrieved September 17, 2009, from:
http://www.rma.org/scrap-tire/scrap-tire-markets/.
Venta, G. J., & Nisbet, M. (2000). Life Cycle Analysis of Residential Roofing Products. Prepared for Athena
Sustainable Materials Institute, Ottawa.
Food Waste
Bernatz, G. (2009). Apples, Bananas, and Oranges: Using GIS to Determine Distance Travelled, Energy
Use, and Emissions from Imported Fruit. Volume 11, Papers in Resource Analysis. 16 pp. Saint
Mary’s University of Minnesota Central Services Press. Winona, MN.
Battagliese et al. (2013). More Sustainable Beef Optimization Project. Phase 1 Final Report, June 2013.
Submitted by BASF Corporation.
Battagliese (2014). Email Correspondence with Thomas Battagliese, BASF. February 27, 2014.
Ecoinvent Centre. (2015). Ecoinvent data v3.2. Ecoinvent reports No.1-25, Swiss Centre for Life Cycle
Inventories, Dübendorf, 20015. Retrieved from: www.ecoinvent.org.
Espinoza-Orias, N., H. Stichnothe, and A. Azapagic. (2011). The Carbon Footprint of Bread. International
Journal of Life Cycle Assessment, (2011) 16:351–365
Fake, C., K.M. Klonsky, and R.L. De Moura. (2009). Sample Costs to Produce Mixed Vegetables.
University of California Cooperative Extension. VM-IR-09. Retrieved from:
http://coststudies.ucdavis.edu/files/MixedVegIR09.pdf.
Luske, B. (2010). Comprehensive Carbon Footprint Assessment Dole Bananas. Soil and More
International. Retrieved from: http://dolecrs.com/uploads/2012/06/Soil-More-CarbonFootprint-
Assessment.p
Nemecek, T., and Kagi, T. (2007). Life Cycle Inventories of Agricultural Production Systems. Ecoinvent
Report No. 15.

WARM Data Quality Assessment 75
O’Connell, N.V., C.E. Kallsen, K.M. Klonsky, and R.L. De Moura. (2009). Sample Costs to Establish an
Orange Orchard and Produce Oranges. University of California Cooperative Extension. OR-VS-09.
Retrieved from: http://coststudies.ucdavis.edu/files/orangevs2009.pdf.
Pelletier (2010). What’s at Steak? Ecological Economic Sustainability and the Ethical, Environmental, and
Policy Implications for Global Livestock Production (Dalhousie University, 2010).
Pelletier (2008). Environmental performance in the US broiler poultry sector: Life cycle energy use and
greenhouse gas, ozone depleting, acidifying and eutrophying emissions. Agricultural Systems 98
(2008): 67-73.
Stoddard, C.S., M. LeStrange, B. Aegerter, K.M. Klonsky, and R.L. De Moura. (2007). Sample Costs to
Produce Fresh Market Tomatoes. University of California Cooperative Extension. TM-SJ-07.
Retrieved from: http://coststudies.ucdavis.edu/files/tomatofrmktsj07.pdf.
Thoma, G., et al. 2010. Global Warming Potential of Fluid Milk Consumed in the US: A Life Cycle
Assessment. Innovation Center for U.S. Dairy and University of Arkansas
USDA. (2012a). Estimating Wheat Supply and Food Use. U.S. Department of Agriculture Economic
Research Service
USDA. (2012b). Food Availability (per Capita) Data System – 2010. U.S. Department of Agriculture
Economic Research Service
Venkat (2012). Comparison of Twelve Organic and Conventional Farming Systems: A Life Cycle
Greenhouse Gas Emissions Perspective.
Wunderlich, L., K.M. Klonsky, and R.L. De Moura. (2007). Sample Costs to Establish and Produce Apples.
University of California Cooperative Extension. AP-IR-07. Retrieved from:
http://cecentralsierra.ucanr.edu/files/60510.pdf.
Yard Trimmings
Barlaz, M.A. (1998). Carbon storage during biodegradation of municipal solid waste components in
laboratory-scale landfills. Global Biogeochem. Cycles, 12 (2): 373–380.
EPA. (2018a). Advancing Sustainable Materials Management: Facts and Figures 2015. (EPA530-F-18-
004). Washington, DC: U.S. Government Printing Office.
EPA. (2006). Solid Waste Management and Greenhouse Gases: A Life-Cycle Assessment of Emissions and
Sinks. Washington, DC: U.S. Environmental Protection Agency.
FAL. (1994). The Role of Recycling in Integrated Solid Waste Management to the Year 2000. Franklin
Associates, Ltd. (Stamford, CT: Keep America Beautiful, Inc.), September, pp. I-24.
Hodge, K. L., Levis, J. W., DeCarolis, J. F., & Barlaz, M. A. (2016). Systematic evaluation of industrial,
commercial, and institutional food waste management strategies in the United States.
Environmental science & technology, 50(16), 8444-8452
IPCC. (2006). 2006 IPCC Guidelines for National Greenhouse Gas Inventories, Volume 5: Waste, Chapter
3: Solid Waste Disposal. Intergovernmental Panel on Climate Change

WARM Data Quality Assessment 76
Levis, J. and Barlaz, M.A. (2014). Landfill Gas Monte Carlo Model Documentation and Results. June 18,
2014.
Landfilling
Barlaz, M.A. (1998). Carbon storage during biodegradation of municipal solid waste components in
laboratory-scale landfills. Global Biogeochemical Cycles, 12 (2), 373–380.
Bingemer, H G., & Crutzen, P. J. (1987). The Production of Methane from Solid Wastes. Journal of
Geophysical Research, 90 (D2), 2181–2187.
De la Cruz, F. B., & Barlaz, M. A. (2010). Estimation of Waste Component-Specific Landfill Decay Rates
Using Laboratory-Scale Decomposition Data. Environmental Science & Technology, 44 (12),
4722–4728. Doi:10.1021/es100240r.
Eklund B., Anderson, E., Walker, B., & Burrows, D. (1998). Characterization of landfill gas composition at
the Fresh Kills municipal solid-waste landfill. Environmental Science & Technology, 32, 15, 2233–
2237.
EPA (2018c) Greenhouse Gas Reporting Program (GHGRP). Subpart HH: Municipal Solid Waste Landfills
and Subpart TT: Industrial Waste Landfills. 2018 Envirofacts. Available online at:
https://www.epa.gov/enviro/greenhouse-gas-customized-search
Freed, J., Skog, K., Mintz, C., & Glick, N. (2004). Carbon Storage due to Disposal of Biogenic Materials in
U.S. Landfills. Proceedings of the Third Annual Conference on Carbon Sequestration. U.S.
Department of Energy.
Levis, J. and Barlaz, M.A. (2014). Landfill Gas Monte Carlo Model Documentation and Results. June 18,
2014.
Levis, J. W., Barlaz, M. A., DeCarolis, J. F., Ranjithan, S. R. (2013). What is the optimal way for a suburban
U.S. city to sustainably manage future solid waste? Perspectives from a Solid Waste
Optimization Life-cycle Framework (SWOLF). Environmental Science & Technology, submitted.
Wang, X., Padgett, J.M., De la Cruz, F.B., and Barlaz, M.A. (2011). Wood Biodegradation in Laboratory-
Scale Landfills. Environmental Science & Technology, 2011 (45), 6864-6871.
Wang, X., Padgett, J. M., Powell, J. S., Barlaz, M. A. (2013). Decomposition of Forest Products Buried in
Landfills. Waste Management, 33 (11), 2267-2276.
Composting
Amlinger, F., P. Stefan, and C. Cuhls. 2008. Greenhouse gas emissions from composting and mechanical
biological treatment. Waste Management & Research. 26: 47-60.
Beck-Friis, B., Pell, M., Sonesson, U., Jonsson, H., and Kirchmann, H. (2000). Formation and Emission of
N2O and CH4 from Compost Heaps of Organic Household Waste. Environmental Monitoring and
Assessment. 62: 317–331.
FAL. (1994). The Role of Recycling in Integrated Solid Waste Management to the Year 2000. Franklin
Associates, Ltd. (Stamford, CT: Keep America Beautiful, Inc.), September, pp. I-24.

WARM Data Quality Assessment 77
National Renewable Energy Laboratory (2015). “U.S. Life Cycle Inventory Database.” Retrieved from
https://www.lcacommons.gov/nrel/search
Oregon Department of Environmental Quality (DEQ) (2014). Evaluation of Climate, Energy, and Soils
Impacts of Selected Food Discards Management Systems. Available online at:
https://www.oregon.gov/deq/FilterDocs/FoodWasteStudyReport.pdf
Williams, S. R., Zhu-Barker, X., Lew, S., Croze, B. J., Fallan, K. R., & Horwath, W. R. (2019). Impact of
composting food waste with green waste on greenhouse gas emissions from compost windrows.
Compost Science & Utilization, 27(1), 35-45.
Combustion
Bahor, B. (2010). Personal communications between Victoria Thompson, ICF International, and Brian
Bahor, Covanta Energy. May 24, 2010; June 7, 2010; and July 14, 2010.
Bergman, R., & Bowe, S. A. (2008). Environmental impact of producing hardwood lumber using life-cycle
inventory. Wood and Fiber Science, 40(3), 448-458. Retrieved October 20, 2009 from
http://www.treesearch.fs.fed.us/pubs/31113.
DeZan, D. (2000). Personal communication between Diane DeZan, Fiber Economics Bureau and Joe
Casola, ICF Consulting. 4 August 2000.
FAL. (1994). The Role of Recycling in Integrated Solid Waste Management to the Year 2000. Franklin
Associates, Ltd. (Stamford, CT: Keep America Beautiful, Inc.), September, pp. I-24.
Fons, W. L., Clements, H. B., Elliott, E. R., & George, P. M. (1962). Project Fire Model. Summary Progress
Report-II. Period May 1, 1960 to April 30, 1962. Macon, GA: U.S. Department of Agriculture,
Forest Service, Southeastern Forest Experiment Station, Southern Forest Fire Laboratory. 58 pp.
[16824].
Gaines, L., and Stodolsky, F. (1993). Mandated Recycling Rates: Impacts on Energy Consumption and
Municipal Solid Waste Volume. Argonne, IL: Argonne National Laboratory, pp. 11 and 85.
Harrington, K. (1997). Personal communication by facsimile with Karen Harrington, principal planner for
the Minnesota Office of Environmental Assistance. October 1997.
Incropera, F. P., & DeWitt, D. P. (1990). Introduction to Heat Transfer, Second Edition. New York: John
Wiley & Sons, pp. A3-A4.
IPCC. (2007). Climate Change 2007: The Physical Science Basis. Contribution of Working Group I to the
Fourth Assessment Report of the Intergovernmental Panel on Climate Change. Cambridge
University Press, Cambridge, United Kingdom and New York, NY, USA.
IWSA & American Ref-Fuel (1997). Telephone conversation among representatives of Integrated Waste
Services Association, American Ref-Fuel, and ICF Consulting, October 28, 1997.
IWSA. (2000). The 2000 IWSA Waste-To-Energy Directory of United States Facilities. Washington, DC:
Integrated Waste Services Association.
National Renewable Energy Laboratory (2015). "U.S. Life Cycle Inventory Database." Retrieved from
https://www.lcacommons.gov/nrel/search

WARM Data Quality Assessment 78
NREL. (1992). Data Summary of Municipal Solid Waste Management Alternatives, Volume IV: Appendix
B - RDF Technologies. Springfield, VA: National Technical Information Service, National
Renewable Energy Laboratory/TP-431-4988D), p. B-5.
Procter and Redfern, Ltd. & ORTECH International. (1993). Estimation of the Effects of Various Municipal
Waste Management Strategies on Greenhouse Gas Emissions, Part II. Ottawa, Canada:
Environment Canada, Solid Waste Management Division, and Natural Resources Canada,
Alternative Energy Division.
Realff, M. (2010). The role of using carpet as a fuel in carpet recovery system development. Delivered to
ICF International via email on September 9, 2010.
Van Haaren, R., Goldstein, N., & Themelis, N.J. (2008). The State of Garbage in America. BioCycle, 51
(10), 16.
Zannes, M. (1997). Personal communication with Maria Zannes of Integrated Waste Services
Association, Washington, DC. August 25, 1997.
Anaerobic Digestion
Barlaz, M.A. (1998). Carbon storage during biodegradation of municipal solid waste components in
laboratory-scale landfills. Global Biogeochem. Cycles, 12 (2): 373–380.
Beck-Friis, B., Pell, M., Sonesson, U., Jonsson, H., and Kirchmann, H. (2000). Formation and Emission of
N2O and CH4 from Compost Heaps of Organic Household Waste. Environmental Monitoring and
Assessment. 62: 317–331.
Boldrin, A., Neidel, T. L., Damgaard, A., Bhander, G. S., Møller, J., & Christensen, T. H. (2011). Modelling
of environmental impacts from biological treatment of organic municipal waste in EASEWASTE.
Waste Management (New York, N.Y.), 31(4), 619–30. doi:10.1016/j.wasman.2010.10.025.
EPA. (2013). The Landfill Methane Outreach Program (LMOP) LFGE Benefits Calculator. Available online
at: http://www.epa.gov/lmop/projects-candidates/lfge-calculator.html.
Møller, J., Boldrin, A., & Christensen, T. H. (2009). Anaerobic digestion and digestate use: accounting of
greenhouse gases and global warming contribution. Waste Management & Research: The
Journal of the International Solid Wastes and Public Cleansing Association, ISWA, 27(8), 813–24.
doi:10.1177/0734242X09344876
National Renewable Energy Laboratory (2015). "U.S. Life Cycle Inventory Database." Retrieved from
https://www.lcacommons.gov.
Riber, C.; Petersen, C.; Christensen, T.H., (2009). Chemical composition of material fractions in Danish
household waste. Waste Manage., 29(4), 1251–1257.

WARM Data Quality Assessment 79
Appendix: Data Quality Assessment Matrix
The table below provides the detailed results on the scoring for each data source following the ORD Guidance scoring approach. Low scores equate with high
data quality.
Summary of Data Quality Assessment by Material Type and Management Pathway
Dataset
Data Source
Flow Indicators
Process Indicators
Total
Score
Average
Score
Weighted
Average
Score and
Key Sources
(Y)
Flow
Reliability
Flow representativeness
Process
Review
Process
Complete
ness
Temporal
correlation
Geographical
correlation
Technological
correlation
Data collection
methods
Unit process(es)
Reference
Data
generation
method &
verification
Data year
Region of
data
Technology
type, scale
Representativeness,
sample size
Third party
or
internal
reviewer(s)
% of
flows
covered
IDEAL SCORE
1
1
1
1
1
1
1
7
1
1
Plastics
a
Average Score
2.0
3.7
1.7
1.7
1.3
4.0
2.3
16.7
2.3
2.2
Process energy emissions to
manufacture Virgin HDPE, LDPE,
PET, LLDPE, PP
FAL 2011
1
5
1
2
1
5
1
14
2.3
Y
Process energy emissions to
manufacture Virgin GPPS, PVC
FAL 2011
1
5
1
2
1
5
1
16
2.3
Y
Process energy emissions to
manufacture Recycled PET, HDPE,
and PP
FAL 2018
2
2
2
1
1
3
1
12
1.7
Y
Retail transportation distance and
fuel-type
BTS 2013
3
4
2
2
2
4
5
22
3.1
Bioplastics
a
Average Score
2.0
4.5
2.3
1.5
1.8
1.8
2.0
15.8
2.2
2.2
Process energy and emissions for
PLA production
NatureWorks
2010
1
4
2
2
2
1
1
13
1.9
Y
Process energy and emissions for
PLA production
Erwin Vink's
responses 2010
1
4
1
2
2
3
2
15
2.1
Y
Transportation energy usage
FAL 1994
2
5
1
1
2
1
1
13
1.9
Retail transportation distance and
fuel-type
BTS 2013
3
4
2
2
2
4
5
22
3.1
Transportation emissions
Oregon DEQ
(2014)
2
5
4
1
1
1
1
15
2.1

WARM Data Quality Assessment 80
Dataset
Data Source
Flow Indicators
Process Indicators
Total
Score
Average
Score
Weighted
Average
Score and
Key Sources
(Y)
Flow
Reliability
Flow representativeness
Process
Review
Process
Complete
ness
Temporal
correlation
Geographical
correlation
Technological
correlation
Data collection
methods
Unit process(es)
Reference
Data
generation
method &
verification
Data year
Region of
data
Technology
type, scale
Representativeness,
sample size
Third party
or
internal
reviewer(s)
% of
flows
covered
Metals
a
Average Score
3.0
4.6
1.8
2.0
3.6
3.2
3.3
21.5
3.1
2.9
Aluminum Cans/Ingot
Average Score
2.8
4.4
2.0
2.0
3.2
2.9
2.6
19.9
2.8
2.6
Process energy and process non-
energy data for manufacturing,
recovery, and recycling
PE Americas 2010
2
4
1
1
2 (cans); 3 (ingot)
2
1
13
(cans);
14
(ingot)
1.9
(cans);
2.0
(ingot)
Y
Transportation energy data
RTI 2004
5
5
5
5
5
5
5
35
5.0
Retail transportation energy data
EPA 1998b
2
5
1
1
4
2
1
15.5
2.2
Retail transportation distance and
fuel-type
BTS 2013
3
4
2
2
2
4
5
22
3.1
Steel Cans
Average Score
3.7
4.8
2.4
2.4
4.2
3.9
3.4
24.8
3.5
3.2
Steel cans process energy and
process non-energy,
transportation energy
EPA 1998a
5
5
1
1
5
4
1
22
3.1
Y
Current mix of steel can
production and recycled contents
of production
FAL 2003a
4
5
3
3
5
5
5
30
4.2
Steel Cans loss rates
FAL 2003b
5
5
5
5
5
5
5
35
5.0
Retail transportation energy data
EPA 1998b
2
5
1
1
4
2
1
15.5
2.2
Retail transportation distance and
fuel type
BTS 2013
3
4
2
2
2
4
5
22
3.1
Copper
Average Score
2.5
4.5
1.3
1.5
3.0
3.0
4.0
19.8
2.8
3.0
Process energy, process non-
energy, and transportation energy
FAL 2002
4
5
1
2
5
2
5
24
3.4
Y
% of current production from
recycled vs. “virgin” inputs,
copper wire scrap mix used to
create copper ingot.
USGS 2004
1
4
1
1
2
4
5
18
2.6
Retail transportation energy data
EPA 1998b
2
5
1
1
4
2
1
15.5
2.2
Retail transportation distance and
fuel type
BTS 2013
3
4
2
2
2
4
5
22
3.1
Glass
a
Average Score
3.5
4.8
2.5
2.5
3.7
3.0
3.0
23
3.3
3.5

WARM Data Quality Assessment 81
Dataset
Data Source
Flow Indicators
Process Indicators
Total
Score
Average
Score
Weighted
Average
Score and
Key Sources
(Y)
Flow
Reliability
Flow representativeness
Process
Review
Process
Complete
ness
Temporal
correlation
Geographical
correlation
Technological
correlation
Data collection
methods
Unit process(es)
Reference
Data
generation
method &
verification
Data year
Region of
data
Technology
type, scale
Representativeness,
sample size
Third party
or
internal
reviewer(s)
% of
flows
covered
Process energy and process non-
energy
RTI 2004
5
5
5
5
5
5
5
35
5.0
Y
Composition of glass and fuel
used to combust glass
DOE 2002
4
5
1
1
5
1
1
18
2.6
Current mix of production from
virgin and recycled inputs and
glass loss rates
FAL 2003b
5
5
5
5
5
5
5
35
5.0
Transportation energy usage
FAL 1994
2
5
1
1
2
1
1
13
1.9
Retail transportation distance and
fuel type
BTS 2013
3
4
2
2
2
4
5
22
3.1
Transportation fuel efficiencies
EPA 1998b
2
5
1
1
4
2
1
15.5
2.2
Paper
Average Score
4
5
3
3
4
4
3
25
3.50
3.48
Energy and process emissions
RTI (2004)
5
5
5
5
5
5
5
35
5.0
Y
Process emissions
EPA (1998a)
5.0
5.0
1.0
1.0
5.0
4.0
1.0
22
3.1
Y
Composition of Mixed Paper
Categories
FAL (1998)
2
5
1
1
3
2
1
15
2.1
Y
Current mix of recycled content
FAL 2003a
4
5
3
3
5
5
5
30
4.2
Current mix of production from
virgin and recycled inputs
FAL 2003b
5
5
5
5
5
5
5
35
5.0
Transportation Energy
BTS (2013)
3
4
2
2
2
4
5
22
3.1
Fuel-specific carbon content/co-
efficients
EPA (2015)
4
4
1
1
1
1
1
13
1.9
Electronics
Average Score
2
3
2
1
3
2
1
16
2.3
2.2
Cellphone materials and LCA
Andrea and Vaija
(2014)
2
3
4
1
4
2
1
17
2.4
Process emissions for electronic
components
ANL (2018)
2
2
1
1
1
1
1
9
1.3
Y
Component mass share of
electronics
Babbitt et al.
(2017)
1
2
1
2
1
1
1
9
1.3
Y

WARM Data Quality Assessment 82
Dataset
Data Source
Flow Indicators
Process Indicators
Total
Score
Average
Score
Weighted
Average
Score and
Key Sources
(Y)
Flow
Reliability
Flow representativeness
Process
Review
Process
Complete
ness
Temporal
correlation
Geographical
correlation
Technological
correlation
Data collection
methods
Unit process(es)
Reference
Data
generation
method &
verification
Data year
Region of
data
Technology
type, scale
Representativeness,
sample size
Third party
or
internal
reviewer(s)
% of
flows
covered
Recycling emissions for electronic
types
Bigum et al.
(2012)
2
4
4
1
1
3
1
16
2.3
Recycling emissions from lithium
cobalt oxide batteries
Dewulf et al.
(2010)
1
4
4
2
5
3
1
20
2.9
Process emissions for metals in
electronics
Ecoinvent Centre
(2015)
1
3
4
1
1
1
1
12
1.7
Y
General electronic disposal
information
EPA (2008)
2
5
1
1
1
5
1
16
2.3
Fate of plastic in recycled
electronics
FAL (2018)
2
2
2
1
1
3
1
12
1.7
Virgin production of plastic and
recycled plastic in electronics
FAL (2011a)
2
4
2
1
1
3
1
14
2.0
LCI of postconsumer HDPE and
PET
FAL (2011b)
2
4
1
2
1
3
1
14
2.0
Process energy, process non-
energy, and transportation energy
for virgin and recycled copper
FAL (2002)
4
5
1
2
5
2
5
24
3.4
Component mass share of
electronics
Hikwama (2005)
2
5
3
1
5
5
1
22
3.1
Mixed electronics share estimate
Mars et al. (2016)
4
3
4
1
5
1
1
19
2.7
Virgin production emissions for
printed circuit boards, flat panel
display modules, and batteries
Teehan and
Kandlikar (2013)
2
3
2
1
5
3
1
17
2.4
Y
CRT materials recovered from
recycling
Turner et al.
(2015)
4
3
1
1
5
1
1
16
2.3
Emission information on LCD TVs
Vanegas et al.
(2015)
4
3
3
3
5
2
1
21
3.0
Construction Materials
Asphalt Concrete
Average Score
2
5
2
1
2
3
1
16
2.3
2.7
Composition of hot mix asphalt
Hassan (2009)
2
5
1
1
5
5
1
20
2.9
Y
Material and fuel mix inputs
US Census Bureau
(1997)
1
5
1
1
1
1
1
11
1.6

WARM Data Quality Assessment 83
Dataset
Data Source
Flow Indicators
Process Indicators
Total
Score
Average
Score
Weighted
Average
Score and
Key Sources
(Y)
Flow
Reliability
Flow representativeness
Process
Review
Process
Complete
ness
Temporal
correlation
Geographical
correlation
Technological
correlation
Data collection
methods
Unit process(es)
Reference
Data
generation
method &
verification
Data year
Region of
data
Technology
type, scale
Representativeness,
sample size
Third party
or
internal
reviewer(s)
% of
flows
covered
Limestone manufacturing energy
use
NREL (2009)
2
5
1
1
1
4
1
15
2.1
Process Emissions Factors
Athena
Sustainable
Materials Institute
(2001)
2
5
2
1
1
1
1
13
1.9
Manufacturing energy
consumption - asphalt
Canadian Industry
Program for
Energy
Conservation
(2005)
1
5
4
3
4
1
1
19
2.7
Y
Recycling Emissions
Levis (2008)
4
5
1
1
1
4
1
17
2.4
Asphalt Shingles
Average Score
4
5
2
2
2
4
2
20
2.8
2.8
Manufacturing - virgin production
Athena
Sustainable
Materials Institute
(2000)
2
5
3
1
1
2
1
15
2.1
Y
Composition, Recycling, and
Combustion of shingles
CMRA (2007)
4
5
1
2
5
5
5
27
3.9
Y
Recycling Emissions
Cochran (2006)
4
5
1
1
1
4
1
17
2.4
Recycling loss rate
Berenyi (2007)
4
5
1
2
1
4
1
18
2.6
Carpet
Average Score
3
5
3
3
3
4
3
26
3.7
3.4
Fuel mix, energy use in
manufacturing
FAL (2002)
4
5
1
2
5
2
5
24
3.4
Y
Process emissions, fuel mix
EPA (2003)
2
5
1
1
1
4
1
15
2.1
Y
Process and transportation
emissions
Plastics Europe
(2005a)
1
5
4
4
5
4
5
28
4.0
Process and transportation
emissions
Plastics Europe
(2005b)
1
5
4
4
5
4
5
28
4.0
Material composition, Recycling
Realff (2011)
5
4
5
5
5
5
5
34
4.9
Clay Bricks
Average Score
2
4
2
1
1
1
1
11
1.6
1.6

WARM Data Quality Assessment 84
Dataset
Data Source
Flow Indicators
Process Indicators
Total
Score
Average
Score
Weighted
Average
Score and
Key Sources
(Y)
Flow
Reliability
Flow representativeness
Process
Review
Process
Complete
ness
Temporal
correlation
Geographical
correlation
Technological
correlation
Data collection
methods
Unit process(es)
Reference
Data
generation
method &
verification
Data year
Region of
data
Technology
type, scale
Representativeness,
sample size
Third party
or
internal
reviewer(s)
% of
flows
covered
Process and transportation
emissions
Athena (1998)
2
5
3
1
1
1
1
14
2.0
Y
Process and transportation
emissions
EPA (2018b)
1
2
1
1
1
1
1
8
1.1
Y
Concrete
Average Score
1
5
1
3
1
4
1
16
2.2
2.2
Process and transportation
emissions - virgin
EPA (2003)
1
5
1
2
1
4
1
15
2.1
Y
Process and transportation
emissions - recycled
Wilburn and
Goonan (1998)
1
5
1
3
1
4
1
16
2.3
Dimensional Lumber
Average Score
2
4
2
2
1
1
1
12
1.7
1.7
Cradle to gate GHG emissions for
new and recycled
Bergman et al.
(2013)
2
4
1
2
1
1
1
12
1.7
Y
Cradle to gate GHG emissions for
new
American Wood
Council (2013)
2
4
2
1
1
1
1
12
1.7
Drywall
Average Score
2
5
2
2
1
2
2
16
2.2
2.1
Manufacturing, fuel mix,
transportation
Venta (1997)
2
5
3
1
1
1
1
14
2.0
Y
Moisture content and carbon
storage factor
Staley and Barlaz
(2009)
2
4
1
1
1
1
1
11
1.6
Process emissions and fuel mix
FAL (2007)
2
5
1
1
1
1
1
12
1.7
Y
Composition of recycled drywall
WRAP (2008)
2
5
4
3
1
5
1
21
3.0
Transportation Energy
BTS (2013)
3
4
2
2
2
4
5
22
3.1
Transportation Energy - recycled
drywall
U.S. Census
Bureau (2004)
1
5
1
1
1
1
1
11
1.6
Fiberglass Insulation
Average Score
3
5
3
2
2
3
2
20
2.8
3.1
Sourcing raw material - sand
Athena
Sustainable
Materials Institute
(2000)
2
5
4
1
1
2
1
16
2.3
Sourcing raw material - soda ash
and limestone
NREL (2009)
2
5
1
1
1
4
1
15
2.1

WARM Data Quality Assessment 85
Dataset
Data Source
Flow Indicators
Process Indicators
Total
Score
Average
Score
Weighted
Average
Score and
Key Sources
(Y)
Flow
Reliability
Flow representativeness
Process
Review
Process
Complete
ness
Temporal
correlation
Geographical
correlation
Technological
correlation
Data collection
methods
Unit process(es)
Reference
Data
generation
method &
verification
Data year
Region of
data
Technology
type, scale
Representativeness,
sample size
Third party
or
internal
reviewer(s)
% of
flows
covered
Glass Recycling & Transport
emissions
Enviros Consulting
(2003)
2
5
4
2
1
4
1
19
2.7
Transportation Energy
BTS (2013)
3
4
2
2
2
4
5
22
3.1
Manufacturing process and
emissions
Miller (2010)
5
4
5
5
5
5
5
34
4.9
Manufacturing process and
emissions
Lippiatt (2007)
2
5
1
1
1
1
1
12
1.7
Y
Fly Ash
Average Score
2
5
1
1
1
4
1
15
2.1
2.1
Recycling emissions
EPA (2003)
2
5
1
1
1
4
1
15
2.1
Y
Medium-density Fiberboard
Average Score
2
3
2
1
1
1
1
11
1.5
1.5
Manufacturing and transportation
Wilson (2010)
2
4
1
1
1
1
1
11
1.6
Y
Manufacturing - virgin inputs
Composite Panel
Association (2018
2
2
2
1
1
1
1
10
1.4
Structural Steel
Average Score
2
3
2
2
2
2
2
14
2.0
1.9
Transportation emissions
BTS (2013)
3
4
2
2
2
4
5
22
3.1
Transportation emissions
EPA (1998)
2
5
1
1
3
2
1
15
2.1
Composition of structural steel -
virgin inputs
U.S. Department
of Commerce
(2020)
1
2
1
2
1
4
1
12
1.7
Composition of structural steel -
virgin inputs
World Steel
Association (2020)
2
2
4
2
1
1
1
13
1.9
manufacturing and transportation
emissions - virgin inputs
AISI (2017)
1
3
4
1
1
1
1
12
1.7
Y
Process emissions; manufacturing
- recycled inputs
AISI (2016)
2
3
1
1
1
1
1
10
1.4
Y
Vinyl Flooring
Average Score
2
5
3
2
2
3
2
19
2.7
2.9
Transportation emissions
ECOBILAN (2001)
2
5
4
1
2
4
1
19
2.7
Manufacturing process and
emissions
Jones (1999)
3
5
5
3
5
4
5
30
4.3
VCT life cycle emissions
Lippiatt (2007)
2
5
1
1
1
1
1
12
1.7
Y
Composition of vinyl flooring
Baitz et al. (2004)
2
5
4
3
1
1
1
17
2.4
Y

WARM Data Quality Assessment 86
Dataset
Data Source
Flow Indicators
Process Indicators
Total
Score
Average
Score
Weighted
Average
Score and
Key Sources
(Y)
Flow
Reliability
Flow representativeness
Process
Review
Process
Complete
ness
Temporal
correlation
Geographical
correlation
Technological
correlation
Data collection
methods
Unit process(es)
Reference
Data
generation
method &
verification
Data year
Region of
data
Technology
type, scale
Representativeness,
sample size
Third party
or
internal
reviewer(s)
% of
flows
covered
Manufacturing process and
emissions
FAL (2007)
2
5
1
1
1
1
1
12
1.7
Transportation Energy
BTS (2013)
3
4
2
2
2
4
5
22
3.1
Wood Flooring
Average Score
2
5
2
2
2
2
2
16
2.3
2.3
Cradle to gate GHG emissions for
new and recycled
Berman et al.
(2013)
2
4
1
2
1
1
1
12
1.7
Manufacturing - virgin inputs
American Wood
Council (2013)
2
4
2
1
1
1
1
12
1.7
Transportation Energy
BTS (2013)
3
4
2
2
2
4
5
22
3.1
Manufacturing material
consumption
Bergman and
Bowe (2008)
2
5
1
2
4
1
1
16
2.3
Y
Manufacturing and transportation
Hubbard and
Bowe (2008)
2
5
2
2
4
2
1
18
2.6
Y
Harvesting wood - energy use
Athena
Sustainable
Materials Institute
(2000)
2
5
4
1
1
2
1
16
2.3
Y
Tires
Average Score
3
5
2
2
3
4
2
21
3.0
3.0
Scrap tire end-of-life usage
RMA (2009a)
4
4
1
1
1
5
1
17
2.4
Y
Process energy requirements for a
new tire
Atech Group
(2001)
4
5
3
2
1
3
1
19
2.7
Y
Tire energy content for
combustion
CIWMB (1992)
2
5
2
1
5
5
1
21
3.0
Retention rate and energy
required for pulverization process
(method of recycling)
Corti and
Lombardi (2004)
3
5
3
1
5
2
1
20
2.9
Fuel consumption for virgin tires
EIA (2009)
2
5
1
1
1
5
1
16
2.3
Assumptions for composition,
uses, and energy of scrap tires
EPA (1998)
2
5
1
1
3
2
1
15
2.1
Transportation energy
requirements
FAL (1994)
2
5
1
1
2
1
1
13
1.9
Scrap tire life cycle emissions
ICF (2006)
4
5
3
1
5
5
1
24
3.4

WARM Data Quality Assessment 87
Dataset
Data Source
Flow Indicators
Process Indicators
Total
Score
Average
Score
Weighted
Average
Score and
Key Sources
(Y)
Flow
Reliability
Flow representativeness
Process
Review
Process
Complete
ness
Temporal
correlation
Geographical
correlation
Technological
correlation
Data collection
methods
Unit process(es)
Reference
Data
generation
method &
verification
Data year
Region of
data
Technology
type, scale
Representativeness,
sample size
Third party
or
internal
reviewer(s)
% of
flows
covered
Method for retreading tires (used
in documentation chapter)
Nevada
Automotive Test
Center (2004)
5
5
1
1
5
5
1
23
3.3
Composition of fiber in tires
NIST (1997)
5
5
1
1
5
5
1
23
3.3
Offset energy from sand in rubber
Venta and Nisbet
(2000)
2
5
4
1
1
2
1
16
2.3
Tire manufacturing energy
RMA (2010a)
5
4
5
5
5
5
5
34
4.9
Industry average scrap tire
recovery rate
RMA (2010b)
5
4
5
5
5
5
5
34
4.9
Cryogenic grinding process (used
in documentation chapter)
Praxair (2009)
5
4
5
5
5
5
5
34
4.9
Retail transport requirements
NREL (2015)
1
3
1
1
1
2
1
10
1.4
Synthetic rubber manufacturing
and transportation
Pimentel et al.
(2002)
4
5
1
1
1
5
5
22
3.1
Scrap tire average weight
RMA (2009b)
2
4
1
1
1
5
1
15
2.1
Retail transport requirements
BTS (2013)
3
4
2
2
2
4
5
22
3.1
Food Waste
Average Score
1.8
4.1
2.1
1.2
2.1
2.5
1.1
15
2.1
2.1
Beef
Average Score
2
3
1
1
1
4
1
13
1.9
1.9
Cradle to packing plant emission
and energy factors for beef
production
Battagliese (2014)
2
3
1
1
1
4
1
13
1.9
Y
Cradle to packing plant emission
and energy factors for beef
production
Battagliese et al.
(2013)
2
3
1
1
1
4
1
13
1.9
Y
Poultry
Average Score
2
4
1
1
2
3
1
14
2.0
2.0
Cradle to farm energy and
emission factors for poultry
Pelletier (2008)
2
4
1
1
3
3
1
15
2.1
Y
Cradle to farm energy and
emission factors for poultry
Pelletier (2010)
2
4
1
1
1
3
1
13
1.9
Y
Grains and Bread
Average Score
1
4
4
1
3
1
1
16
2.3
2.3
LCI data for grain drying
Nemecek and Kagi
(2007)
2
4
5
1
4
1
1
18
2.6

WARM Data Quality Assessment 88
Dataset
Data Source
Flow Indicators
Process Indicators
Total
Score
Average
Score
Weighted
Average
Score and
Key Sources
(Y)
Flow
Reliability
Flow representativeness
Process
Review
Process
Complete
ness
Temporal
correlation
Geographical
correlation
Technological
correlation
Data collection
methods
Unit process(es)
Reference
Data
generation
method &
verification
Data year
Region of
data
Technology
type, scale
Representativeness,
sample size
Third party
or
internal
reviewer(s)
% of
flows
covered
Process emissions from bread
production
Espinoza-Orias et
al. (2011)
1
4
5
1
4
1
1
17
2.4
Y
U.S. grains supply data
USDA (2012a)
1
5
1
2
2
1
2
14
2.0
Y
Fruits and Vegetables
Average Score
2
4
2
1
2
5
2
19
2.7
2.7
Energy impacts of produce
transportation
Bernatz (2009)
2
5
1
1
1
5
1
16
2.3
Cradle to farm GHG emissions for
fruits and vegetables
Venkat (2012)
2
4
1
1
1
5
1
15
2.1
Y
Vegetables production data
Fake et al (2009)
3
4
2
1
3
5
3
215
3.0
Y
Orange production data
O’Connell et al.
(2009)
3
4
2
1
3
5
3
21
3.0
Y
Tomato production data
Stoddard et al.
(2007)
3
5
2
1
3
5
3
22
3.1
Y
Apple production data
Wunderlich et al.
(2007)
3
5
3
1
4
5
4
25
3.6
Y
Banana production data
Luske (2010)
2
5
3
1
2
5
2
20
2.9
Y
Potato production data
Ecoinvent 2.0
1
3
4
1
1
1
1
12
1.7
Y
Dairy Products
Average Score
3
4
1
2
1
2
1
13
1.9
1.8
Process emissions from milk
production
Thoma et al.
(2010)
3
4
1
1
1
1
1
12
1.7
Y
U.S. dairy supply data
USDA (2012b)
2
4
1
2
1
3
1
14
2.0
Yard Trimmings
Average Score
2
4
1
1
1
3
1
13
1.7
1.6
Transportation emissions
FAL (1994)
2
5
1
1
2
1
1
13
1.9
Carbon storage data
Barlaz (1998)
1
5
1
1
1
3
1
13
1.9
Y
Process emissions and energy
consumption
Hodge et al.
(2016)
2
3
1
3
2
1
1
13
1.9
Y
U.S. yard trimmings generation
and treatment data
EPA (2018a)
2
3
1
1
1
4
1
13
1.9
Landfill gas collection efficiency
modeling
Levis and Barlaz
(2014)
2
3
1
1
1
5
1
14
2.0
Process emissions and energy
consumption
EPA (2006)
2
5
1
1
2
4
1
16
2.3
Y

WARM Data Quality Assessment 89
Dataset
Data Source
Flow Indicators
Process Indicators
Total
Score
Average
Score
Weighted
Average
Score and
Key Sources
(Y)
Flow
Reliability
Flow representativeness
Process
Review
Process
Complete
ness
Temporal
correlation
Geographical
correlation
Technological
correlation
Data collection
methods
Unit process(es)
Reference
Data
generation
method &
verification
Data year
Region of
data
Technology
type, scale
Representativeness,
sample size
Third party
or
internal
reviewer(s)
% of
flows
covered
N
2
O values for yard trimmings
combustion
IPCC (2006)
1
5
3
1
1
1
1
13
1.9
Y
Landfilling
Average Score
2
4
1
2
1
2
1
14
2.0
2.1
Landfill gas collection
Levis and Barlaz
(2014)
4
3
1
1
1
5
1
16
2.3
Y
Landfill emissions - carbon
Levis et al. (2013)
2
4
1
1
1
1
1
11
1.6
Y
Landfill emissions
EPA (2018c)
1
2
1
4
1
5
5
19
2.7
Aerobic decomposition & landfill
emissions
Freed et al. (2004)
4
5
1
1
1
5
1
18
2.6
Landfill emissions - CO2 and CH4
Bingemer and
Crutzen (1987)
2
5
2
3
1
1
1
15
2.1
Landfill emissions - VOCs
Eklund B et al.
(1998)
1
5
1
2
5
1
1
16
2.3
Landfill emissions - CH4, CO2,
material decomposition
Barlaz (1998)
1
5
1
1
1
3
1
13
1.9
Y
Material decomposition
Wang, X et al.
(2011)
2
4
1
1
1
1
1
11
1.6
Y
Material decomposition
Wang, X et al.
(2013)
2
4
1
1
1
1
1
11
1.6
Component-specific decay rates
De la Cruz and
Barlaz (2010)
2
4
1
1
1
1
1
11
1.6
Y
Composting
Average Score
2
4
2
2
2
1
1
14
2.0
2.0
Composting Emissions - food
waste
Oregon DEQ
(2014)
2
5
4
1
1
1
1
15
2.1
Y
Fugitive emissions for compost
waste
Williams et al.
2019
2
1
2
2
5
1
1
14
2.0
Y
Composition of Composting Waste
Stream
EPA 2014
2
3
1
3
1
4
1
15
2.1
Composting Emissions - GHGs
Amlinger et al.
2008
2
5
4
1
1
1
1
15
2.1
Composting Emissions - yard
waste
FAL (1994)
2
5
1
1
2
1
1
13
1.9
Y

WARM Data Quality Assessment 90
Dataset
Data Source
Flow Indicators
Process Indicators
Total
Score
Average
Score
Weighted
Average
Score and
Key Sources
(Y)
Flow
Reliability
Flow representativeness
Process
Review
Process
Complete
ness
Temporal
correlation
Geographical
correlation
Technological
correlation
Data collection
methods
Unit process(es)
Reference
Data
generation
method &
verification
Data year
Region of
data
Technology
type, scale
Representativeness,
sample size
Third party
or
internal
reviewer(s)
% of
flows
covered
Food and yard waste emissions
NREL (2015)
2
3
1
5
1
1
1
14
2.0
Y
Carbon storage in soil
Beck-Friis et al.
2000
1
5
3
2
1
1
1
14
2.0
Combustion
Average Score
3.1
4.8
3.0
3.2
3.4
3.9
2.8
24
3.4
3.1
Non-biogenic share of carbon in
textiles
DeZan (2000)
5
5
5
5
5
5
5
35
5.0
Percentage of textile discards
combusted in U.S.; non-biogenic
carbon content plastic, textiles,
rubber and leather
Van Haaren et al.
(2008)
1
5
1
2
1
5
1
16
2.3
Y
Transportation emissions
FAL (1994)
2
5
1
1
2
1
1
13
1.9
Transportation emissions
NREL (2015)
1
3
1
1
1
2
1
10
1.4
Carpet and tires combustion
energy content
Realff (2010)
3
4
1
3
5
5
5
26
3.7
Y
Specific heat data of materials
Incropera and
DeWitt (1990)
5
5
5
5
5
5
5
35
5.0
Wood flooring combustion energy
content
Bergman and
Bowe (2008)
1
5
1
2
3
1
2
15
2.1
Y
Energy content of specific
materials in MSW
Gaines and
Stodolsky (1993)
2
5
1
2
5
5
1
15
3.0
Y
Energy content of specific
materials in MSW
Procter and
Redfern (1993)
2
5
5
2
3
3
1
21
3.0
Y
Combustion system efficiency of
mass burn plants
Zannes (1997)
5
5
5
5
5
5
5
35
5.0
Energy content of RDF;
combustion system efficiency
Harrington (1997)
5
5
5
5
5
5
5
35
5.0
Combustion system efficiency of
RDF plants
IWSA (2000)
5
5
5
5
5
5
5
35
5.0
Energy content of mixed MSW
combusted; losses in transmission
and distribution of electricity
specific to WTE combustion
facilities.
IWSA and
American Ref-Fuel
(1997)
5
5
5
5
5
5
5
35
5.0

WARM Data Quality Assessment 91
Dataset
Data Source
Flow Indicators
Process Indicators
Total
Score
Average
Score
Weighted
Average
Score and
Key Sources
(Y)
Flow
Reliability
Flow representativeness
Process
Review
Process
Complete
ness
Temporal
correlation
Geographical
correlation
Technological
correlation
Data collection
methods
Unit process(es)
Reference
Data
generation
method &
verification
Data year
Region of
data
Technology
type, scale
Representativeness,
sample size
Third party
or
internal
reviewer(s)
% of
flows
covered
Energy content of RDF;
combustion system efficiency of
RDF plants
NREL (1992)
1
5
1
2
1
5
1
16
2.3
Y
Amount of steel and ferrous metal
recovered from mixed MSW
combustion
Bahor (2010)
4
4
1
4
1
5
1
20
2.9
Dimensional lumber and
fiberboard energy content
Fons et al. (1962)
2
5
1
2
4
3
2
19
2.7
Y
Combustion emissions
IPCC (2007)
1
5
3
1
1
1
1
13
1.9
Y
Anaerobic Digestion
Average Score
1.4
4.3
3.3
1.4
1.9
3.6
1.3
17.1
2.4
2.1
N
2
O and CH
4
emissions from
compost heaps
Beck-Friis et al.
(2000)
1
5
5
2
5
5
3
26
3.7
Y
GHG reductions as well as
environmental and energy
benefits from an LFG energy
project
EPA (2013)
2
4
1
1
1
5
1
15
2.1
Y
Process emissions
Moller et al.
(2009)
2
4
5
2
3
2
1
19
2.7
Y
Transportation emissions
NREL (2015)
1
3
1
1
1
2
1
10
1.4
Chemical composition of materials
Riber et al. (2009)
1
5
5
1
1
5
1
19
2.7
Process emissions
Boldrin et al.
(2011)
2
4
5
2
1
3
1
18
2.6
Y
Carbon storage
Barlaz (1998)
1
5
1
1
1
3
1
13
1.9
Y
